From MVP to Product: 6 Key Decision Moments (When to Scale, Pivot, Rebuild)
MVP launch starts decision-making, not ends it. Get clear metric thresholds and criteria to decide: iterate, pivot, scale, or stop. Read the full guide.
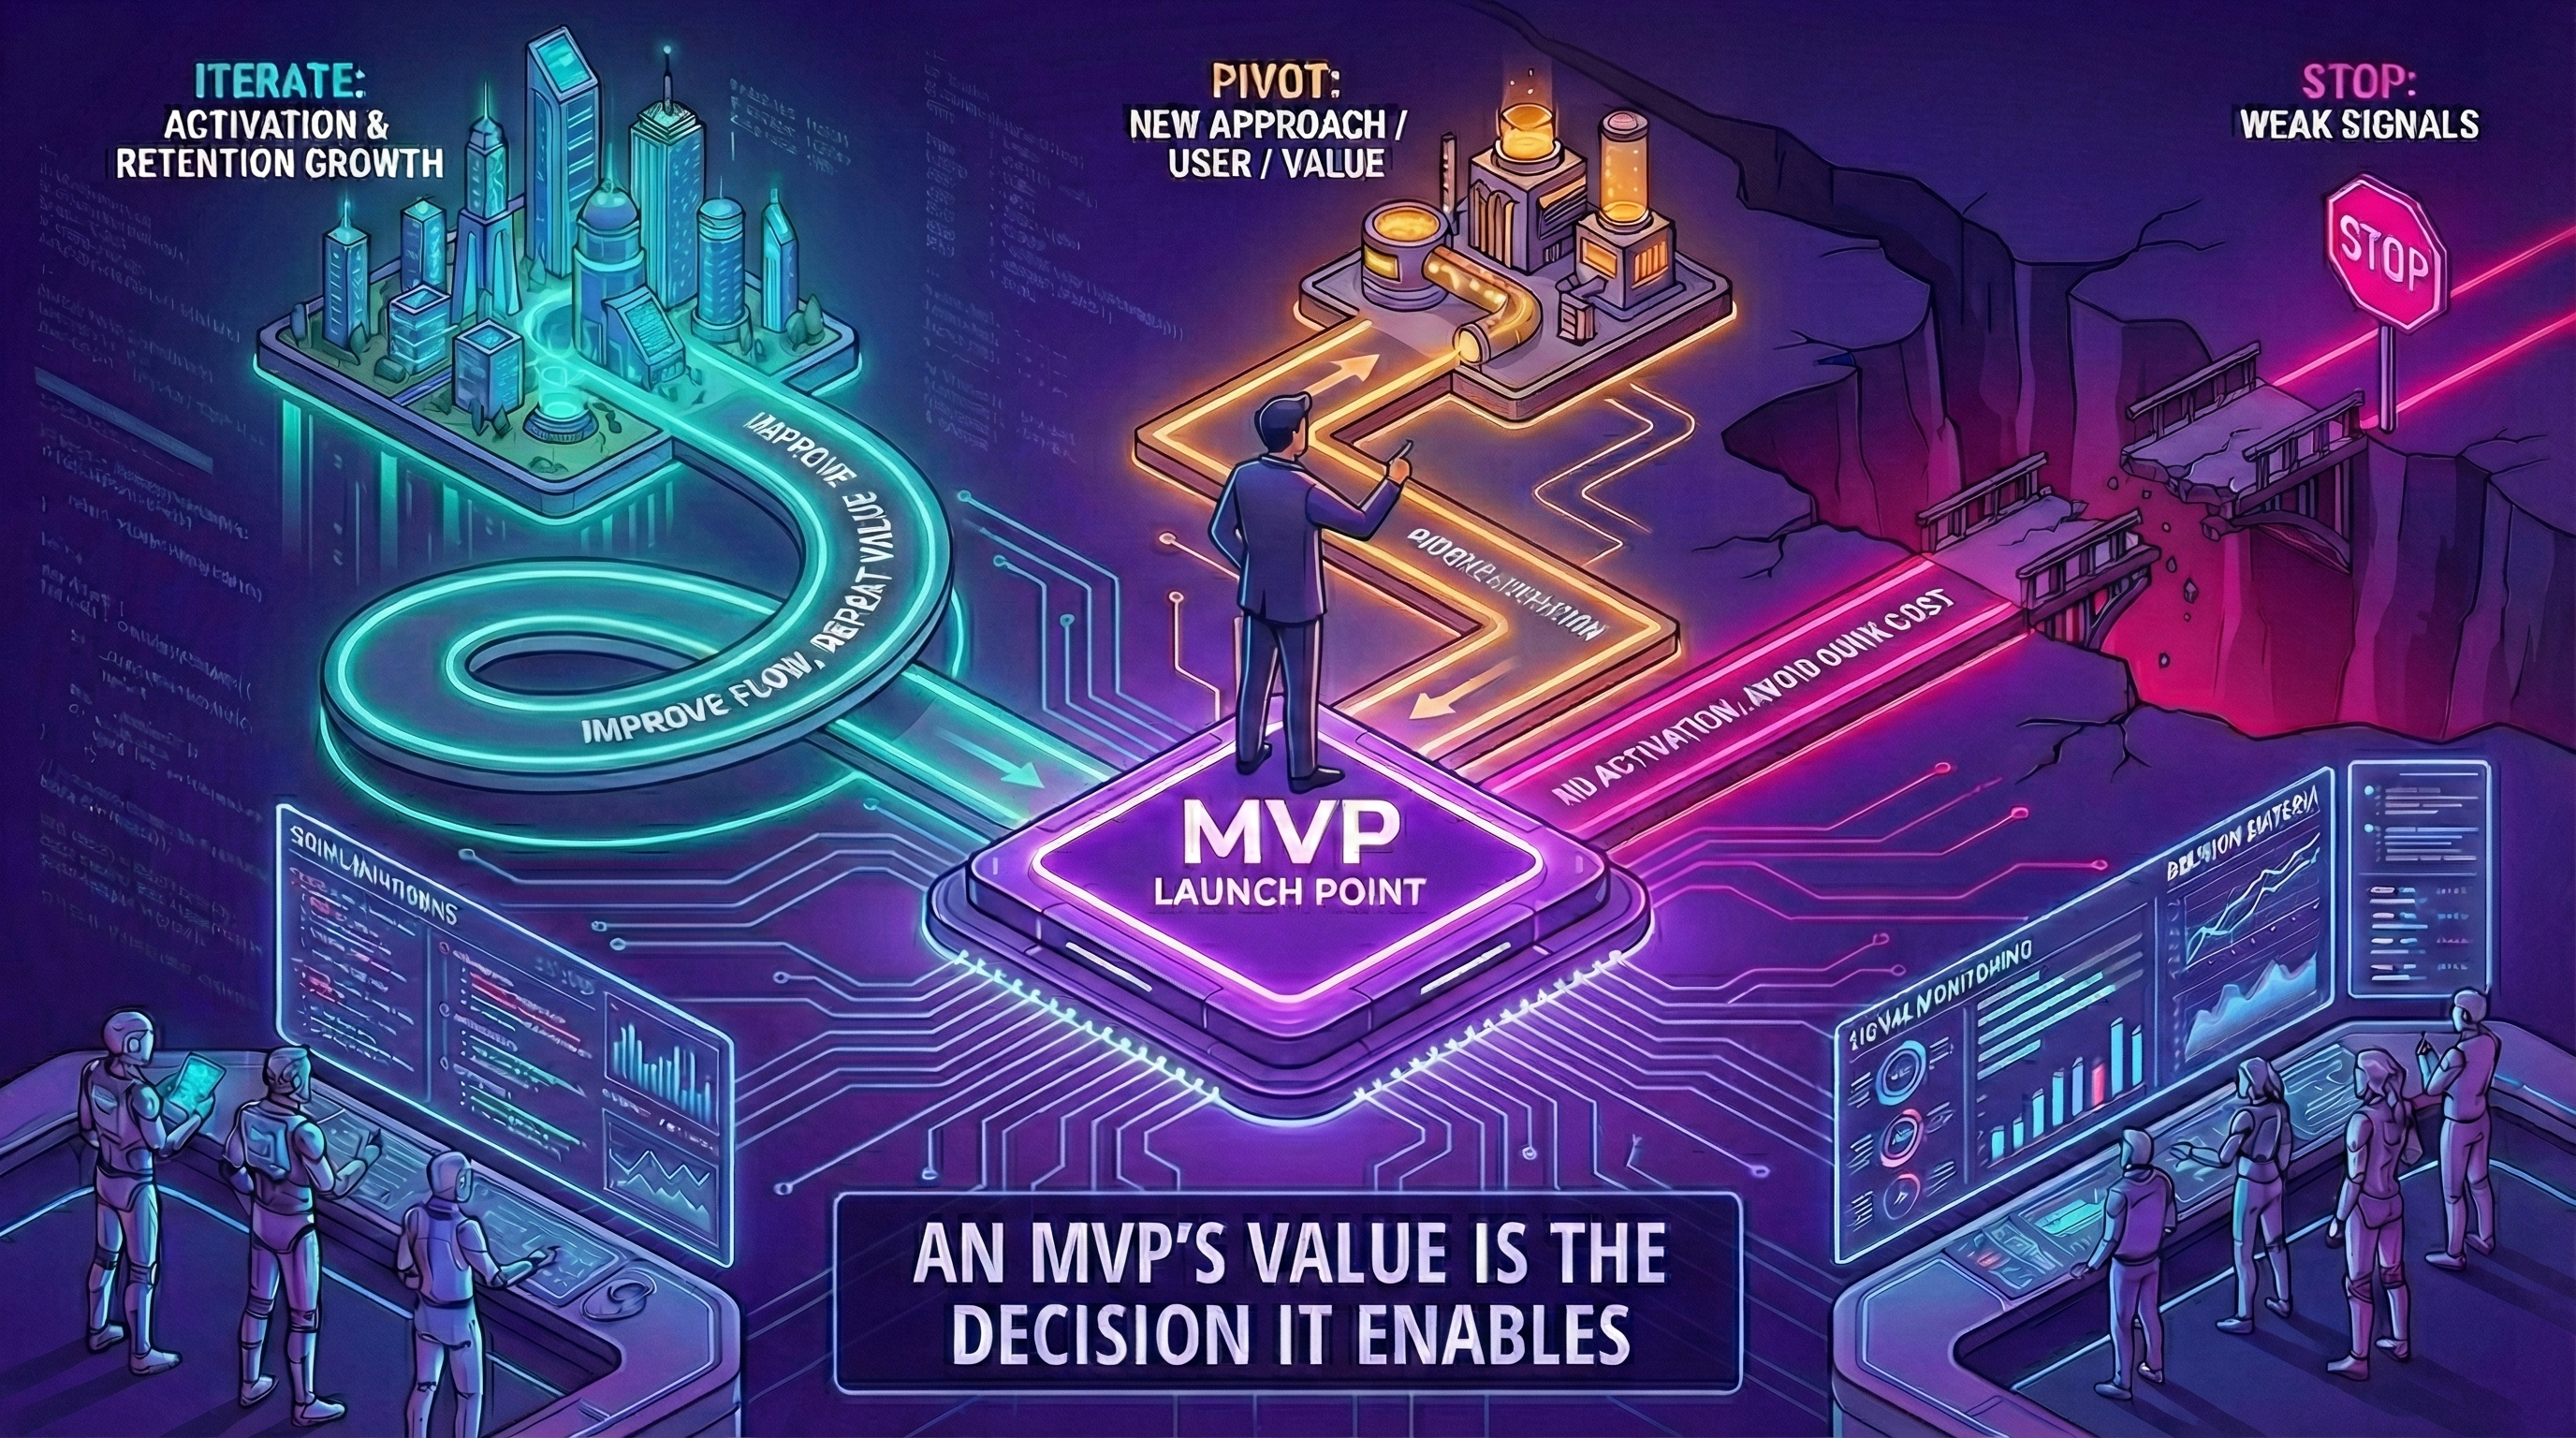
Launching an MVP is not the finish line. It’s the starting point of decision-making.
After launch, momentum can turn into drift. Without explicit criteria, teams build more because it feels safer than deciding.
This framework helps you choose one of four valid paths: iterate, pivot, scale, or stop.
Need help making post-MVP decisions? Talk to our consultants for guidance.
If you haven’t set up measurement yet, start with metrics. If your delivery is chaotic, fix that with MVP project management.
The only question that matters
Is the MVP producing a clear, repeatable signal?
A signal is observable behavior—not compliments, not “users say they like it,” not pageviews.
Observable behavior examples:
- 50% of signups activate within 24h
- 40% return within 7 days
- 5% request pricing info or start trial
Not signals:
- “Users gave positive feedback” (people are polite)
- “We got 500 signups” (without activation context = vanity metric)
- “Investors are interested” (they’re interested in traction, not idea)
The four paths with metric thresholds
1. Iterate (fix execution, keep direction)
When to choose:
- Activation: 30-50% (decent but improvable)
- Retention: 25-40% Day 7 (users see value, not sticky yet)
- Revenue signal: 2-5% (some interest, needs refinement)
What it means: The core idea works, but execution has friction. Improve onboarding, reduce drop-offs, clarify value prop.
Iteration focus:
- Fix biggest drop-off point in funnel (onboarding, first action, re-engagement)
- Simplify core flow (remove steps, reduce clicks, clarify CTAs)
- Test messaging variations (hero copy, value prop, feature descriptions)
Time-box: 4 weeks max per iteration cycle. If no improvement after 2 cycles (8 weeks total), consider pivot.
Example: SaaS tool has 35% activation, 30% Day 7 retention. Users who activate love it, but onboarding confusing. Action: Rebuild onboarding tutorial, target 50% activation in 4 weeks.
2. Pivot (change major variable)
When to choose:
- Activation: <30% (despite iteration attempts)
- Retention: <25% (users don’t come back even after activating)
- Revenue signal: <2% (no willingness to pay)
- BUT: Qualitative signal suggests problem is real (users complain about existing solutions)
What it means: You’re solving a real problem, but your approach is wrong. Change one major variable:
- Target user (enterprise → SMB, consumers → prosumers)
- Value proposition (productivity tool → compliance tool)
- Delivery model (self-serve SaaS → concierge service)
- Core feature (calendar → messaging, search → recommendations)
Pivot rules:
- Change one variable at a time (multiple pivots = new idea, not pivot)
- Keep insights from MVP (user pain points, workflow patterns)
- Re-scope to MVP again (don’t build v2 of pivoted idea)
Time-box: 6-8 weeks for pivot MVP (faster than original MVP because you know what NOT to do).
Example: B2C marketplace has 20% activation, 15% retention. Interviews reveal consumers want it but suppliers don’t. Pivot: B2B tool for suppliers to manage inventory across marketplaces (same tech, different customer).
3. Scale (invest in growth)
When to choose:
- Activation: >50% (strong onboarding)
- Retention: >40% Day 7, >30% Day 30 (sticky product)
- Revenue signal: >5% (clear willingness to pay)
- AND: Repeatable acquisition channel (not just founder network)
What it means: Product-market fit validated. Shift focus from “Does it work?” to “How do we grow?”
Scale priorities:
- Acquisition: Test paid channels (ads, partnerships, sales team)
- Retention optimization: Build re-engagement loops (email, notifications, habit features)
- Revenue: Optimize pricing, upsell paths, reduce churn
- Product roadmap: Build features that increase retention or AOV (average order value)
Avoid premature scaling:
- Retention <40% = leaky bucket (acquisition wasted on churned users)
- No repeatable channel = growth unsustainable (founders can’t manually onboard 1000 users)
Example: Productivity tool has 60% activation, 50% Day 7 retention, 8% trial-to-paid. Founder referrals drove first 100 users, now testing paid ads. Action: Hire growth marketer, allocate €5k/month to paid acquisition experiments.
4. Stop (move to next idea)
When to choose:
- Activation: <20% after 8 weeks of focused iteration
- Retention: <15% Day 7 (users never return)
- Revenue signal: <1% (no one will pay, even at discount)
- AND: Qualitative interviews show weak problem (“nice to have,” not “must have”)
What it means: Signal is consistently weak. Continuing = sunk cost fallacy.
How to decide:
Ask: “Would we start this again today, knowing what we know now?”
- Yes → Iterate or pivot (you believe in the space)
- No → Stop (evidence says it’s not working)
What to do next:
- Extract learnings: What did you learn about the user, market, tech stack?
- Preserve assets: Code, domain, brand can be repurposed
- Move fast: Don’t drag it out. 2 weeks max to wrap up, then start next idea
Example: Social network MVP has 15% activation, 10% Day 7 retention after 12 weeks. Interviews reveal users “like the idea” but don’t need it daily. Action: Sunset product, start new idea with same tech stack.
Decision matrix: which path to choose?
| Signal | Activation | Retention (Day 7) | Revenue Signal | Decision | Time to Decide |
|---|---|---|---|---|---|
| Strong | >50% | >40% | >5% | Scale | 8-12 weeks |
| Decent | 30-50% | 25-40% | 2-5% | Iterate | 4-6 weeks |
| Weak but salvageable | <30% | <25% | <2% (but problem validated) | Pivot | 6-8 weeks (pivot cycle) |
| Consistently weak | <20% | <15% | <1% | Stop | 8-12 weeks total |
Scoring rule: If 2 of 3 metrics hit threshold, follow that decision. If mixed, default to iterate for 4 weeks, then re-assess.
Decision tree

Time-box iteration windows
Define a 4-week iteration sprint with 1-2 metrics to improve.
Sprint structure:
- Week 1: Diagnose (why is activation only 30%? where do users drop off?)
- Week 2: Hypothesis (“If we simplify signup, activation will hit 40%”)
- Week 3: Build + ship (implement fix, deploy)
- Week 4: Measure (did it move the metric?)
Decision triggers (define in advance):
- Green: Metric improves 10+ percentage points → Continue iterating
- Yellow: Metric improves 5-10 points → One more sprint, then decide
- Red: Metric flat or declines → Pivot or stop
Avoid open-ended iteration: “Let’s just keep building” without decision criteria = drift.
Avoid the sunk cost trap
Sunk cost fallacy: “We already spent 3 months and €15k, we can’t stop now.”
Reality: Past investment is irrelevant. Only future opportunity cost matters.
Ask:
- “Would we start this again today, knowing what we know now?”
- “Is 4 more weeks here better than 4 weeks on a new idea?”
If answer is no: Stop. Speed to next idea > clinging to current one.
Timing: when to make the call
Week 4 post-launch: Early signal check (activation, first retention cohort).
- Good signal → Continue
- Weak signal → 1 focused iteration sprint
Week 8 post-launch: Decision checkpoint (2 cohorts, enough data).
- Strong signal (2 of 3 metrics hit) → Scale prep
- Decent signal → 1 more iteration sprint
- Weak signal → Pivot or stop
Week 12 post-launch: Final decision (3 cohorts, clear patterns).
- If still weak → Stop (don’t stretch to Week 16)
Don’t decide too early (Week 1 = noise, not signal) or too late (Week 20 = sunk cost paralysis).
Combine quantitative + qualitative
Metrics tell you what. Interviews tell you why.
Iteration decision (metrics: 35% activation, 28% retention):
- Interview 5 churned users: “Onboarding too confusing, gave up after 3 steps.”
- Decision: Iterate on onboarding (clear why, clear fix).
Pivot decision (metrics: 18% activation, 12% retention):
- Interview 5 activated users: “Love the idea, but we need this for our team, not personal use.”
- Decision: Pivot from B2C to B2B (problem validated, wrong customer).
Stop decision (metrics: 12% activation, 8% retention):
- Interview 10 users: “It’s nice, but we don’t really need it. Existing tools work fine.”
- Decision: Stop (problem not strong enough).
Common decision mistakes
Mistake 1: Pivoting too early
Symptom: Week 2 metrics weak, panic pivot.
Fix: Wait for 2-3 cohorts (8 weeks minimum) before pivot. Early noise ≠ signal.
Mistake 2: Iterating too long
Symptom: Week 16, still at 15% activation, “just one more feature.”
Fix: Define kill criteria in advance (“If activation <25% by Week 12, we stop”).
Mistake 3: Scaling on vanity metrics
Symptom: “We have 1,000 users!” (but 5% activate, 2% return).
Fix: Scale only when retention >40%. Otherwise, growth = burning money on churned users.
Mistake 4: No decision criteria
Symptom: “Let’s see what happens” (indefinite building, no trigger to pivot/stop).
Fix: Write decision rules Week 1 (“If retention <20% by Week 8, we pivot or stop”).
Conclusion
An MVP’s real value is the decision it enables. Iterate when there’s promise, pivot when the signal points elsewhere, scale when metrics hit, stop when evidence is consistently weak.
Remember:
- Iterate: 30-50% activation, 25-40% retention (fix execution)
- Pivot: <30% activation, problem validated (change variable)
- Scale: >50% activation, >40% retention (invest in growth)
- Stop: <20% activation after 8 weeks (move on)
- Time-box: 4-week sprints, decide by Week 8-12 max
Next: Revisit the roadmap with your new signal and plan the next phase.