How to Measure MVP Success: Metrics That Matter (2026 Guide)
Building is half the job—knowing if it works is the other half. Learn the four metric buckets that matter and the decision rules that turn numbers into action. Read the full guide.
Building an MVP is only half the job. The real goal is learning fast enough to make a decision before you waste months building the wrong thing.
Our team has encountered countless founders who ship first and measure later—and they all share the same regret: they wish they’d set up metrics on day one.
Need help setting up your MVP metrics? Talk to our consultants for guidance.
“MVP success” is not polish. It’s whether you can answer:
- Do users reach first value?
- Where do they drop off?
- Do they come back?
- Is there intent to pay?
If you can’t answer these, improve measurement before building more (see delivery discipline).
What MVP success actually means
An MVP is successful if it enables a confident decision:
- iterate (fix specific friction points)
- pivot (change target user or value prop)
- scale (invest in growth)
- stop (move to different idea)
See post-MVP decisions for decision framework based on metrics.
Start with one success question
Define one question your MVP must answer, like:
- “Will users reach first value without help?”
- “Do they come back within a week?”
- “Is there buying intent?”
Your metrics follow from the question, not the other way around.
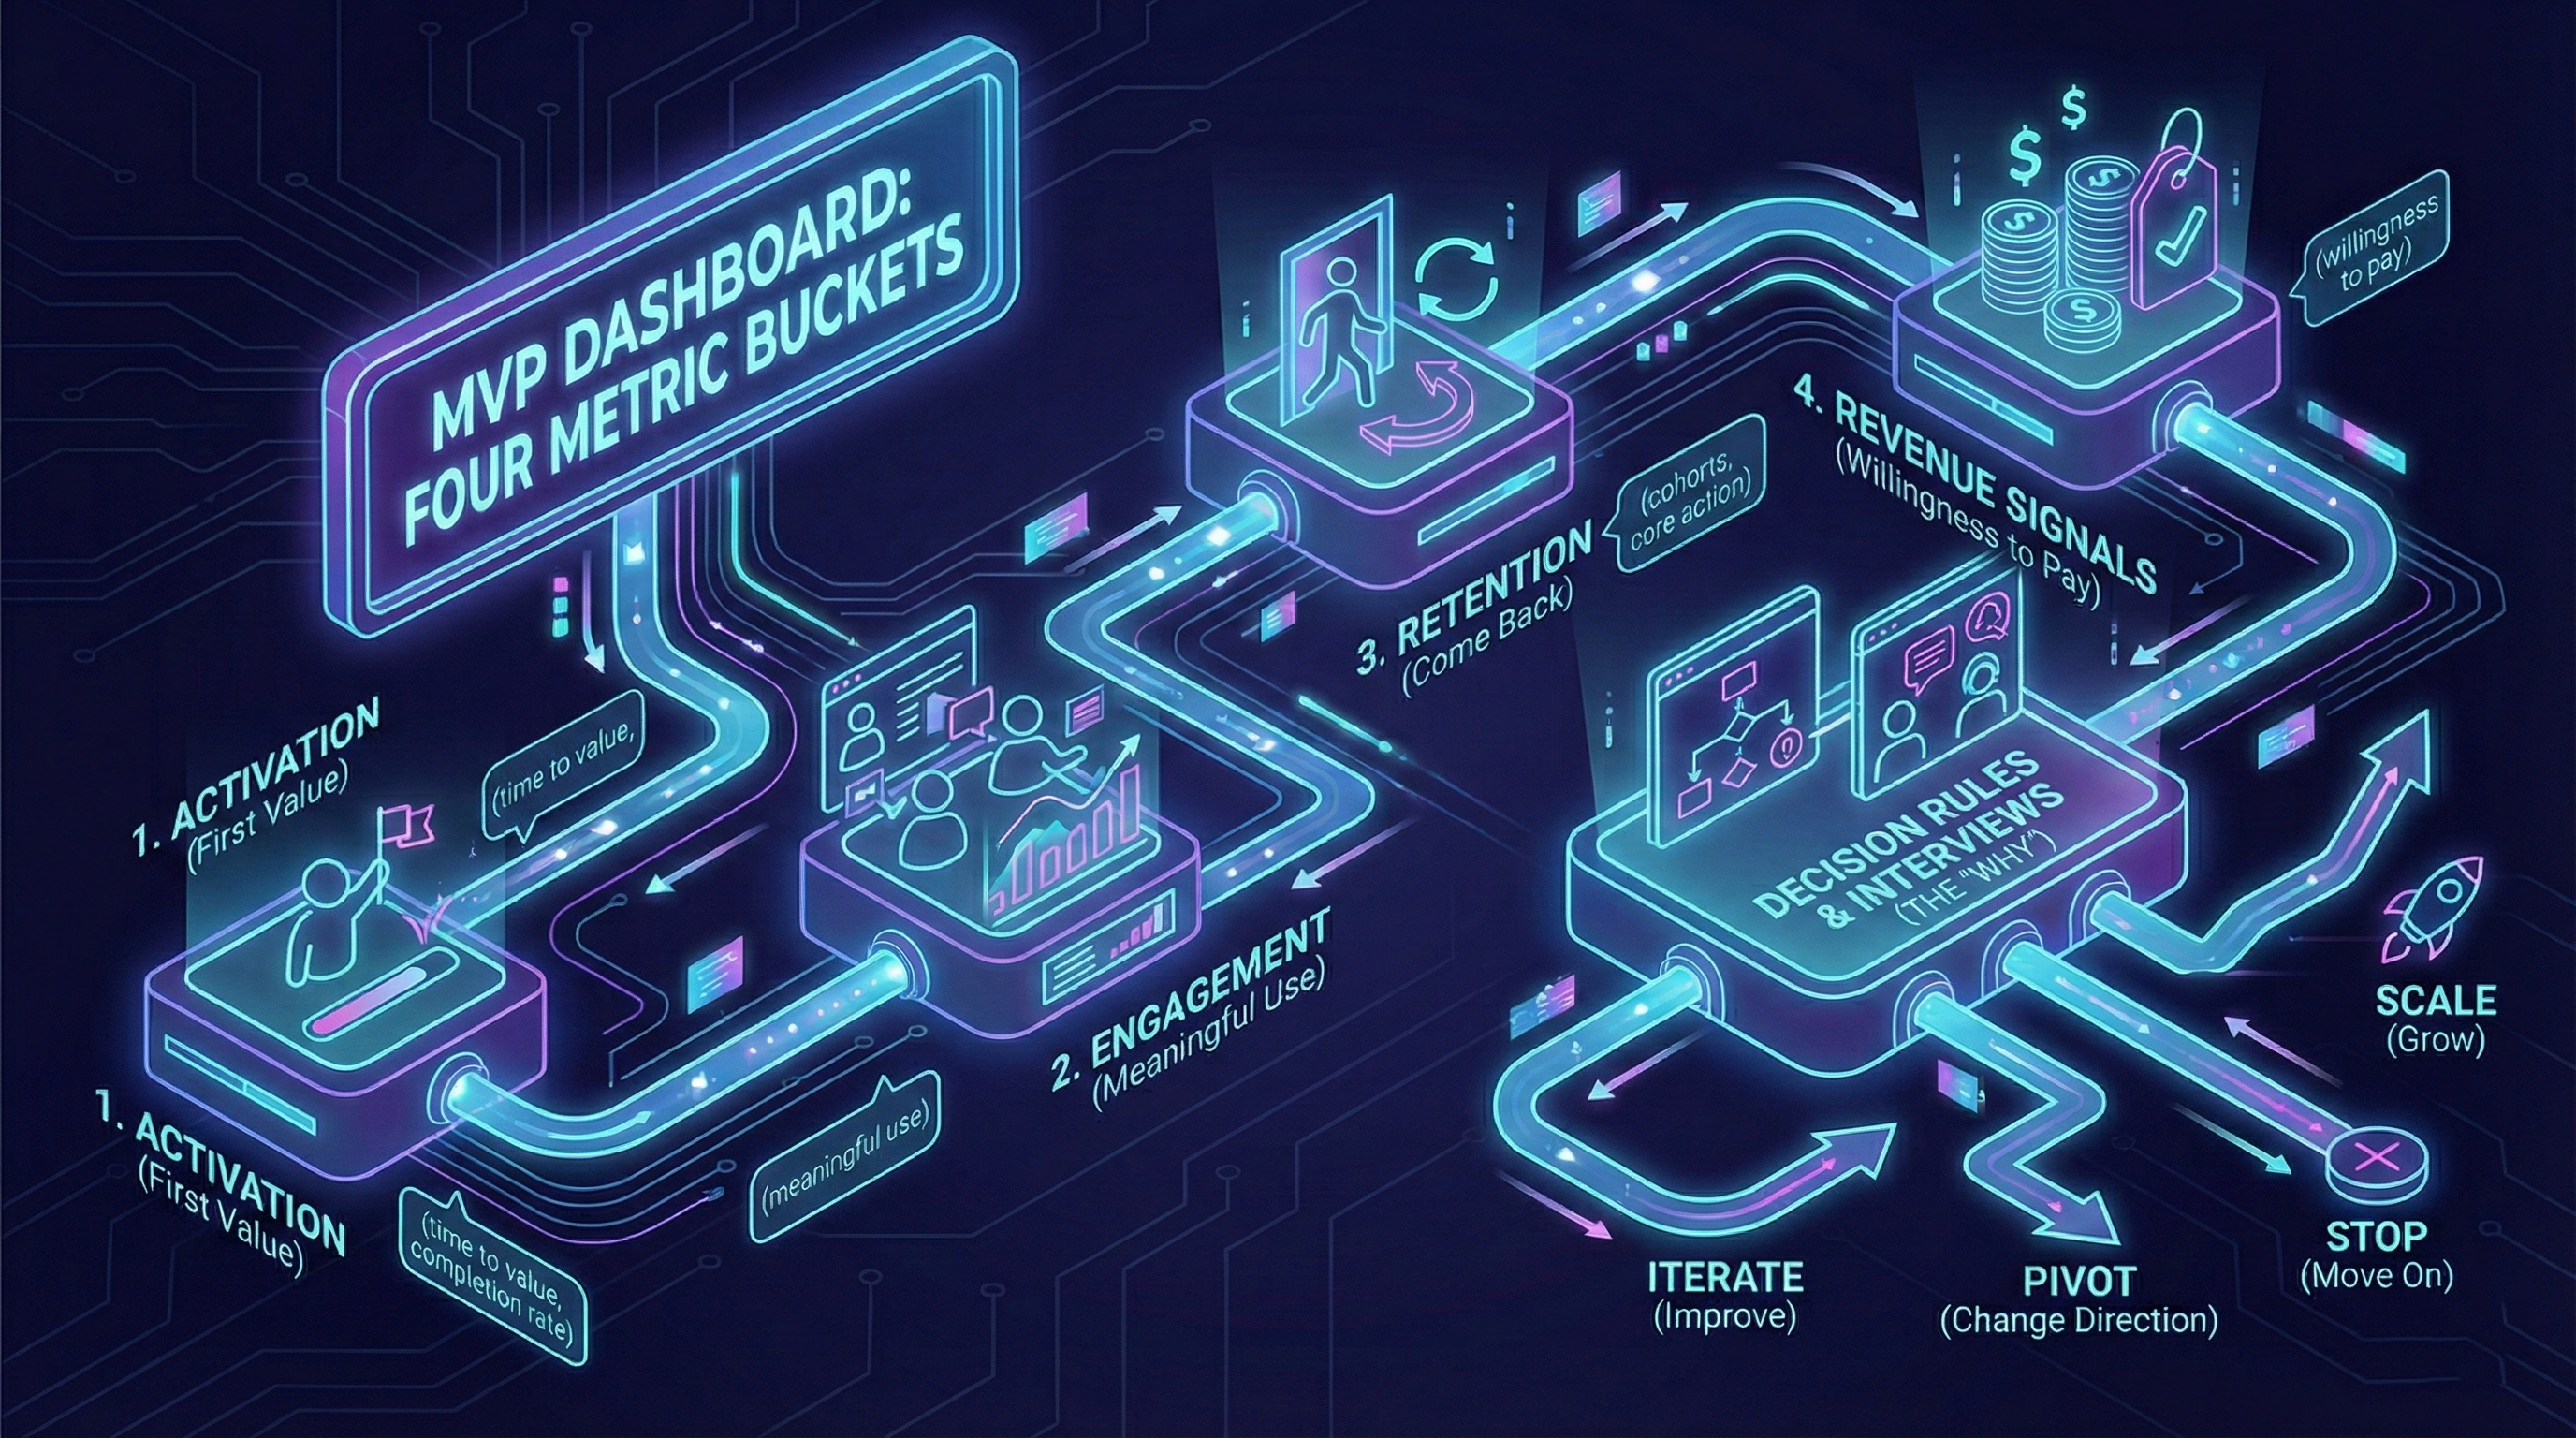
The four metric buckets
Activation
Do users reach first value?
Key metrics:
- Time to value (median minutes from signup to core action)
- Activation rate (% who complete core action within 24h)
- Drop-off points (where users abandon onboarding)
Good benchmark (MVP stage):
- B2B SaaS: 60-70% activation within 48h
- B2C: 40-50% activation within 24h
- Marketplace: 30-40% (supply-side) complete first listing
For pre-launch analytics setup, see our MVP launch checklist.
Engagement
Do they use the product meaningfully?
Key metrics:
- Core action frequency (how often users do the key thing)
- Feature usage depth (do they use 1 feature or 3+?)
- Session duration (for attention-based products)
Avoid: Pageviews, clicks without context (vanity metrics).
Retention
Do they come back?
Key metrics:
- Day 7 retention (% who return within 7 days of signup)
- WAU/MAU ratio (weekly active / monthly active users)
- Cohort retention curves (do they flatten or keep dropping?)
Good benchmark (MVP stage):
- B2B SaaS: 50-60% Week 2 retention
- B2C: 30-40% Day 7 retention
- Marketplace: 40-50% (buyer-side) repeat transaction within 30 days
Critical threshold: 40% WAU/MAU = product-market fit signal (strong retention).
Revenue signals
Do they show willingness to pay?
Key metrics:
- Pricing page visits (intent signal)
- Demo requests / sales calls booked
- Paid pilot signups
- Conversion rate (trial → paid)
Good benchmark (MVP stage):
- B2B: 5-10% trial → paid in first 30 days
- B2C: 2-4% free → paid within 14 days
See pricing validation for paid pilot playbook.
Metrics by MVP type: what to track
B2B SaaS MVP
Primary metrics:
- Activation: “Did they connect data source / complete setup?”
- Engagement: “How many times per week do they use core feature?”
- Retention: “Do 50%+ return in Week 2?”
- Revenue: “Do 5%+ convert to paid pilot?”
Decision threshold: 3 of 4 metrics hit benchmark → iterate toward scale.
B2C Consumer App
Primary metrics:
- Activation: “Did they complete first core action (post, purchase, share)?”
- Engagement: “DAU/MAU ratio >20%?”
- Retention: “Do 30%+ return Day 7?”
- Revenue: “Do 2%+ convert to paid (or ad revenue >$0.10 per user/month)?”
Decision threshold: Retention + engagement hit → focus on growth. Miss both → pivot.
Marketplace MVP
Primary metrics (two-sided):
Learn from a real two-sided platform: Creative Two-Sided Marketplace Platform Case Study—how credibility-first sequencing shaped the validation approach.
- Supply activation: “Do 40%+ suppliers complete first listing?”
- Demand activation: “Do 30%+ buyers complete first transaction?”
- Liquidity: “Time from listing to first inquiry <48h?”
- Repeat rate: “Do 40%+ buyers transact again within 30 days?”
Decision threshold: Liquidity is critical. If listings sit >7 days with zero inquiries, demand problem (not supply).
Vanity metrics vs actionable metrics
Vanity metrics (feel good, no action)
- Total signups (without activation context)
- Pageviews (without conversion or engagement)
- Social media followers (unless direct traffic source)
- App downloads (without activation rate)
Why they’re dangerous: You can have 1,000 signups and 2% activation = 20 real users (failure signal hidden).
Actionable metrics (trigger decisions)
- Activation rate by source (organic 60%, paid ads 20% → kill paid ads)
- Retention cohorts (Week 1 cohort 50%, Week 4 cohort 25% → onboarding degraded)
- Feature usage depth (users using 3+ features retain 2x better → prioritize feature discovery)
Rule: If a metric doesn’t trigger a decision or experiment, don’t track it at MVP stage.
A lightweight MVP dashboard
Track:
- Core funnel events (signup → activation → retention)
- Outcome metrics (time to value, completion rates)
- Retention snapshot (Day 1, Day 7, Day 30)
- Buying intent events (pricing page, demo request, trial start)
Tools for MVP stage:
- Analytics: Plausible (privacy-first, simple) or PostHog (event-based, open-source)
- Error tracking: Sentry (free tier 5k events/month)
- User feedback: Typeform (surveys) + Zoom (interviews)
Dashboard rule: If it doesn’t fit on one screen, it’s too complex for MVP stage.
Delivery + Product Metrics in Practice
EVOC combined both metric types from day one:
Delivery metrics:
- Change lead time (how fast could we test new features?)
- Deployment frequency (were releases getting easier or harder?)
- Change failure rate (were we breaking things?)
Product metrics:
- Report completion rate: 85% (users finishing the flow)
- Time-to-report: <2 minutes (friction in real field conditions)
- Operator review time: 40% faster (validation workflow effectiveness)
Each number was a decision trigger, not a vanity metric. If completion dropped, we knew to simplify inputs. If review slowed, we knew to improve dashboard filters.
This dual-metric approach let the team measure both “Are we shipping fast?” and “Is what we shipped actually working?”
Decision rules (the missing piece)
Decision rules turn data into action.

Example decision rules:
- Activation <40% → Stop building features, fix onboarding (highest leverage)
- Retention 30-50% → Decent signal, test engagement hooks (notifications, email nudges)
- Retention >50% → Strong signal, invest in acquisition (see GTM first users)
- Revenue intent <3% → Pricing problem or value prop unclear (run pricing tests)
Qualitative + Quantitative framework
Numbers tell you what happened. Interviews tell you why.
Weekly learning loop:
- Review funnel (Monday)
- Identify biggest drop-off (signup → activation = 40% only)
- Interview 3-5 users who dropped off (Tuesday-Wednesday)
- Synthesize common friction points (Thursday)
- Ship one focused improvement (Friday)
- Measure impact next Monday
See user interviews for interview playbook and recruiting strategies.
Ratio: 70% quantitative (metrics) + 30% qualitative (interviews) at MVP stage.
Common measurement mistakes
Mistake 1: Tracking too much
Symptom: 20+ metrics on dashboard, no one checks it.
Fix: 5 metrics max (1 per bucket: acquisition, activation, retention, revenue, delivery).
Mistake 2: No decision thresholds
Symptom: “Our activation is 25%, is that good?”
Fix: Define thresholds before launching (“40% = good, 25-40% = iterate, <25% = broken”).
Mistake 3: Ignoring cohorts
Symptom: “Retention is 50%” (but hiding that Week 1 was 60%, now 30%).
Fix: Track retention by signup cohort (weekly or monthly cohorts).
Mistake 4: No qualitative validation
Symptom: Metrics look good but no one understands why users churn.
Fix: Interview 5 churned users. Common reasons: value unclear, friction too high, wrong target user.
When to graduate from MVP metrics
You’re ready to add complexity when:
- Consistent 40%+ retention for 8+ weeks
- 100+ active users (statistical significance)
- Clear product-market fit (revenue growing, churn stable)
Then add: LTV/CAC, cohort revenue curves, feature adoption funnels.
Before that: keep it simple.
Combine metrics with interviews
Numbers tell you what happened. Interviews tell you why (see user interviews). Use a weekly loop:
- Review funnel
- Pick biggest drop-off
- Talk to 3-5 users
- Ship one focused improvement
Conclusion
An MVP succeeds when it produces a clear signal. Track the path to value, define decision rules, and decide confidently.
Remember:
- 4 metric buckets: activation, engagement, retention, revenue
- 40% retention = product-market fit threshold
- Vanity metrics (signups) < Actionable metrics (activation rate by source)
- 5 metrics max, 1 screen dashboard
- 70% quantitative + 30% qualitative
Next: Iterate, pivot, or scale—how to turn metrics into decisions.
Sources
- Sean Ellis: Startup Metrics - Founder of GrowthHackers on activation and retention metrics
- Andrew Chen: Growth Loop - Research on product-led growth and retention curves