Recover AI/No-Code MVP: Audit + Migration Playbook (2026)
Iteration slowing down, fixes introducing regressions, costs rising without progress—these are signs your AI or no-code MVP needs recovery, not more features. This article gives you a 15-point audit to assess salvageability and three concrete recovery paths with realistic costs and timelines.
If you’ve already built an MVP using AI builders, no-code, or low-code tools and now feel stuck, you’re not alone.
Many founders reach a point where:
- Iteration slows down
- Fixes introduce regressions
- Costs rise without clear progress
- The system feels fragile
The big question becomes:
> Can this MVP be recovered—or do we need to rebuild?
This article gives you a realistic framework to answer that question without optimism bias.
For the broader context, start here:
First: What “Recovery” Actually Means
Recovery does not mean:
- Turning a prototype into a perfect system
- Eliminating all technical debt
- Magically scaling without changes
Recovery means:
- Restoring safe iteration
- Stabilizing core flows
- Regaining predictability
- Creating a clear path forward
Sometimes that path includes partial replacement. That’s still recovery.
Step 1: Audit Framework (15-Point Salvageability Checklist)
Before choosing a strategy, audit your MVP. Score Yes or No for each question.
Category A: Data Integrity (0-5 points)
- Data model documented? (schema, relationships, constraints)
- Data exportable? (CSV, JSON, SQL dump)
- No orphaned records? (referential integrity maintained)
- Migrations tracked? (history of schema changes)
- Backups automated? (daily backups, tested restore)
Score: ____ / 5
Category B: Code Quality (0-5 points)
- Code readable? (not AI spaghetti, someone can understand it)
- Business rules centralized? (not scattered in UI components)
- No duplicate logic? (same validation in multiple places)
- Error handling exists? (try-catch, graceful failures)
- Logging in place? (can debug without reproducing)
Score: ____ / 5
Category C: Platform Constraints (0-5 points)
- No vendor lock-in? (can export code/data)
- Platform supports scale? (not hitting row/user limits)
- Costs predictable? (not exponential with usage)
- APIs accessible? (can integrate with external tools)
- Security compliant? (GDPR, SOC2, or relevant standards)
Score: ____ / 5
Total Salvageability Score: ____ / 15
Interpretation:
- 12-15: High salvageability. Stabilize & harden (Option A).
- 8-11: Medium salvageability. Partial rebuild (Option B).
- 4-7: Low salvageability. Clean rebuild likely cheaper (Option C).
- 0-3: Critical state. Rebuild immediately (rescue will cost more).
Step 2: Identify What’s Worth Saving
Not everything needs to be thrown away.
In many recoveries, these parts can be reused:
- Validated UX and user flows (screenshots, Figma, user feedback)
- Domain knowledge (business rules, workflows)
- Integrations (API keys, webhook configs)
- User data (if exportable and clean)
These parts are often not worth saving:
- Brittle glue code (AI-generated spaghetti)
- Duplicated logic (same validation in 5 places)
- Unclear data transformations (“black box” queries)
- Prompt-generated code nobody understands
The goal is not to save lines of code—it’s to save learning.
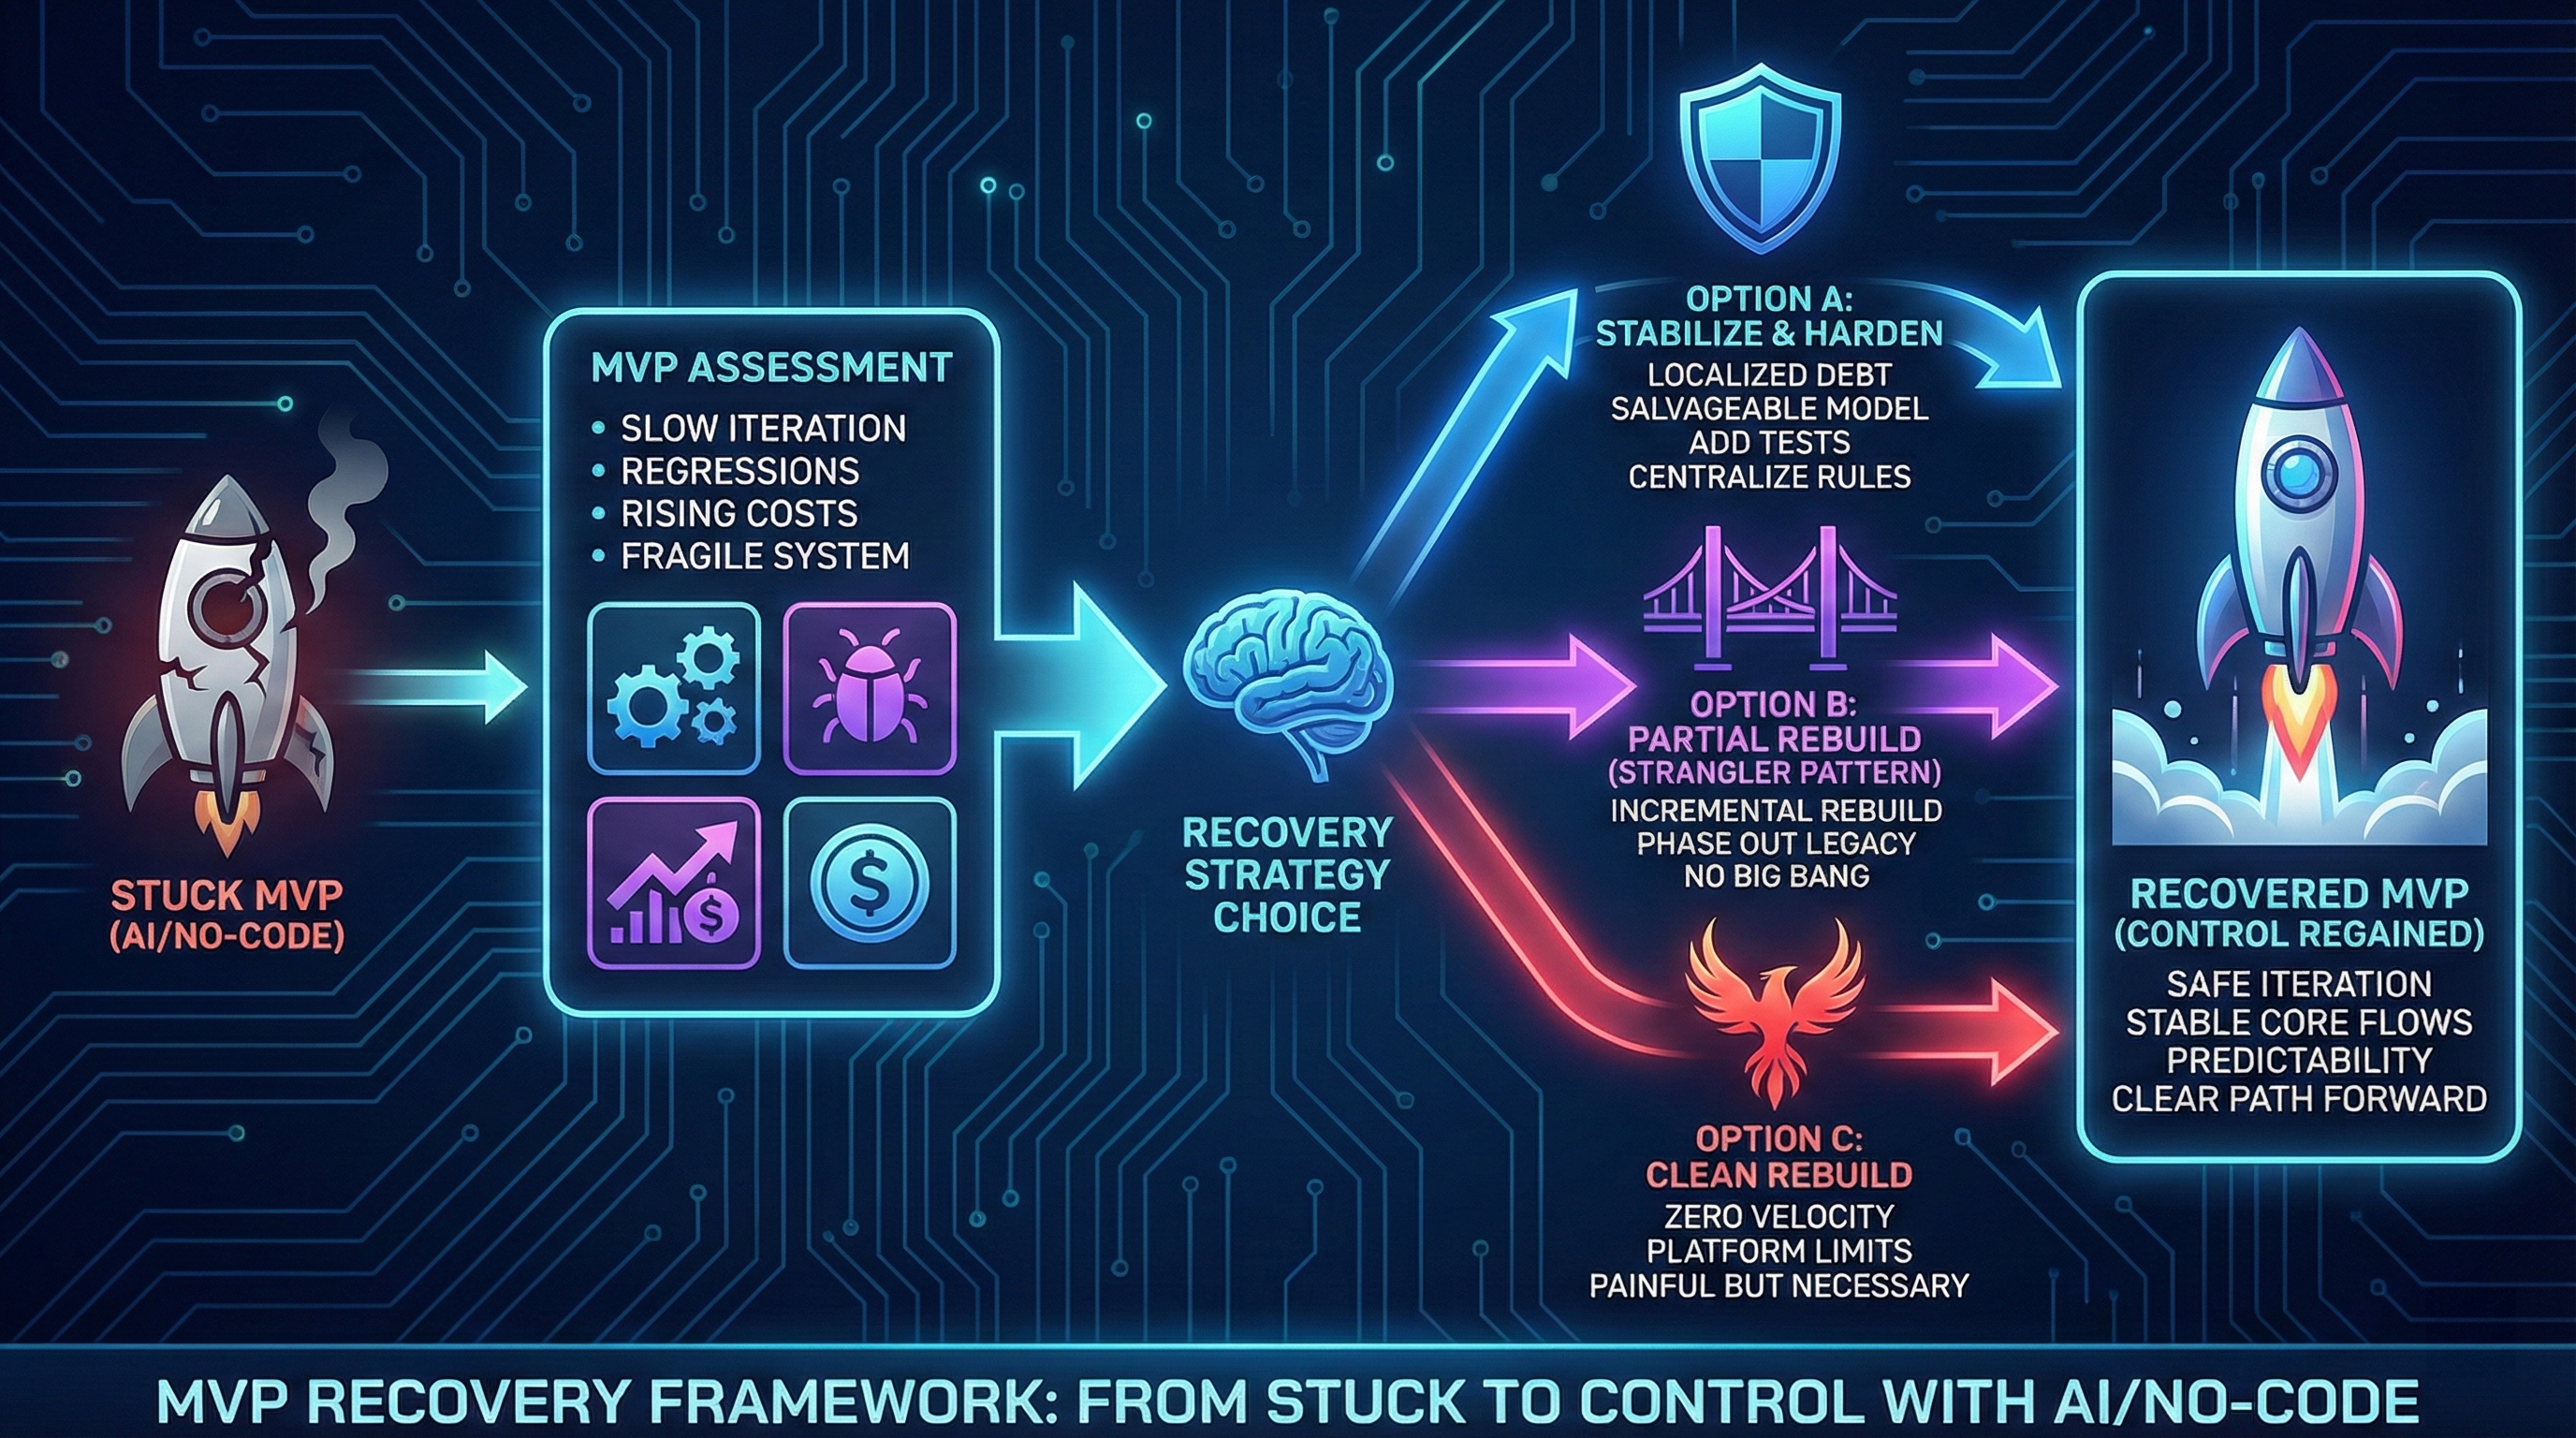
Step 3: Choose the Right Recovery Strategy
There are three common recovery paths.
Option A — Stabilize and Harden
Use this when:
- The system mostly works (core flows stable)
- Debt is localized (1-2 areas problematic)
- Data model is salvageable (exportable + documented)
- Audit score: 12-15
Actions include:
- Freezing feature scope (no new features until stable)
- Adding tests to core flows (auth, payments, key actions)
- Centralizing business rules (move logic out of UI)
- Improving observability (error tracking, logging)
Timeline: 3-5 weeks.
Cost: €4k-€7k (DIY 60-100h @ €60/h or partner €5k-€7k).
Hardening guide:
Option B — Partial Rebuild (Strangler Pattern)
Use this when:
- Core logic is fragile (breaks often)
- Architecture is unclear (no one understands how it works)
- Change is risky (every fix breaks 2 things)
- Audit score: 8-11
In this approach:
- Critical parts are rebuilt incrementally (start with auth, then payments, then core feature)
- Legacy parts are phased out (old code runs in parallel, gradually deprecated)
- Users are not disrupted (no downtime, seamless transition)
Timeline: 6-10 weeks.
Cost: €8k-€14k (partner rebuilds core, keeps stable parts).
This avoids a big-bang rewrite.
External reference: https://martinfowler.com/bliki/StranglerFigApplication.html
Option C — Clean Rebuild
Use this when:
- Velocity is near zero (can’t ship features anymore)
- Regressions are constant (every change breaks something)
- Platform limits block progress (hit row limits, performance degraded)
- Audit score: 0-7
A rebuild is painful—but sometimes cheaper than endless patching.
Timeline: 8-12 weeks.
Cost: €12k-€18k (full MVP rebuild with lessons learned).
This decision should be explicit, not emotional.
The Recovery Decision Flow (Visual)

Migration Playbook: Bubble → Next.js (8 weeks)
Week 1: Audit & Data Export
Actions:
- Run 15-point audit checklist (above)
- Export Bubble data (all tables as CSV)
- Document current workflows (screenshots + user flows)
- Identify critical integrations (Stripe, email, etc.)
Deliverable: Audit report + data export + workflow documentation.
Cost: €1k-€1.5k (10-15h audit).
Week 2: Schema Design & Infrastructure Setup
Actions:
- Design Postgres schema (map Bubble tables to SQL)
- Setup Next.js + Supabase project
- Import data into Supabase (CSV → Postgres)
- Verify data integrity (row counts match, no orphaned records)
Deliverable: New stack deployed to staging, data migrated.
Cost: €1.5k-€2k (15-20h setup).
Week 3-4: Rebuild Core Flows (Priority Order)
Priority 1: Auth (login, signup, password reset)
- Use Supabase Auth (faster than custom)
- Migrate user accounts (preserve passwords with bcrypt)
- Test with 5 beta users
Priority 2: Core Feature (main value-driving flow)
- Rebuild using Next.js + React
- Reuse Bubble UX (don’t redesign, just rebuild)
- Add basic tests (happy path)
Deliverable: Auth + core feature functional in new stack.
Cost: €3k-€4k (30-40h development).
Week 5-6: Secondary Features + Integrations
Actions:
- Rebuild secondary features (admin panel, reporting, etc.)
- Integrate Stripe (webhooks, subscriptions)
- Setup email (Resend, SendGrid, or Postmark)
- Add error tracking (Sentry)
Deliverable: Feature parity with Bubble MVP.
Cost: €2k-€3k (20-30h).
Week 7: Parallel Run & Beta Testing
Actions:
- Run Bubble (production) + Next.js (beta) in parallel
- Invite 10-20 beta users to test new stack
- Monitor for bugs (Sentry alerts)
- Compare performance (load times, error rates)
Deliverable: Confidence in new stack, critical bugs fixed.
Cost: €1k-€1.5k (10-15h testing + fixes).
Week 8: Cutover & Deprecate Bubble
Actions:
- Announce migration (email users 1 week in advance)
- Cutover (switch DNS to Next.js app)
- Monitor closely (24/7 for first 48 hours)
- Keep Bubble read-only for 30 days (safety net)
Deliverable: Fully migrated to Next.js. Bubble deprecated.
Cost: €800-€1.2k (8-12h cutover + monitoring).
Total Migration Cost: €10k-€15k (8 weeks)
Comparison:
- Stabilize Bubble: €4k-€7k but velocity still slow
- Migrate to Next.js: €10k-€15k but long-term scalability
- Rebuild from scratch: €12k-€18k but lose 8 weeks validation
Insight: Migration costs €3k-€8k more than stabilizing, but avoids platform lock-in and unlocks full control.
Cost Comparison: Rescue vs Rebuild
| Scenario | Timeline | Cost | Outcome |
|---|---|---|---|
| Stabilize & harden (Audit 12-15) | 3-5 weeks | €4k-€7k | Core flows stable, velocity improved |
| Partial rebuild (Audit 8-11) | 6-10 weeks | €8k-€14k | Critical parts rebuilt, rest kept |
| Clean rebuild (Audit 0-7) | 8-12 weeks | €12k-€18k | Full control, no legacy debt |
| Do nothing (delay rescue) | 12+ weeks | €15k-€25k | Velocity drops to zero, rebuild forced |
Decision rule:
- If audit score ≥12: Stabilize (€4k-€7k saves €5k-€11k vs rebuild).
- If audit score 8-11: Partial rebuild (€8k-€14k better long-term than endless patches).
- If audit score ≤7: Clean rebuild (€12k-€18k cheaper than rescue + eventual rebuild).
Cost Reality: Why Delay Makes Recovery Harder
Recovery cost grows over time because:
- Knowledge decays (no one remembers why it was built that way)
- Hacks pile up (workarounds on workarounds)
- New features depend on broken foundations (debt compounds)
This is why cost curves matter:
DIY vs Partner: Who Should Handle Recovery?
DIY recovery works when:
- The system is small (<5 features)
- You deeply understand it (wrote most of the code)
- Time pressure is low (can afford 8-12 weeks trial/error)
Partner-led recovery is safer when:
- Business depends on the MVP (downtime = lost revenue)
- Predictability matters (fixed cost, fixed timeline)
- Velocity must return quickly (can’t afford 12 weeks stuck)
Decision help:
How We Approach MVP Recovery at The Byte-sized
We don’t promise miracles.
We start with:
- A short technical assessment (15-point audit + 2h code review)
- Explicit trade-offs (rescue vs rebuild, timeline + cost)
- A recovery plan with milestones (weekly progress demos)
Then we:
- Stabilize before adding features (no new features until core is stable)
- Harden the core loop (tests + monitoring + staging)
- Rebuild selectively where needed (Strangler pattern)
- Use AI as an accelerator, not an autopilot (human-led architecture)
- Show progress weekly (no black box development)
Transparency is key:
Conclusion: Recovery Is About Regaining Control
Recovery is not about perfection. It’s about control.
The sooner you face the reality of your MVP’s state, the more options you have.
Ignoring the problem only narrows those options.
Remember:
- 15-point audit: Data (0-5) + Code (0-5) + Platform (0-5) = salvageability score (12-15 stabilize, 8-11 partial rebuild, 0-7 clean rebuild).
- Migration playbook: Bubble → Next.js 8 weeks (€10k-€15k: Week 1 audit €1k, Week 2 setup €1.5k, Week 3-4 core rebuild €3k, Week 5-6 features €2k, Week 7 testing €1k, Week 8 cutover €800).
- Cost comparison: Stabilize €4k-€7k (saves €5k-€11k vs rebuild), partial €8k-€14k (better long-term), rebuild €12k-€18k (full control), delay = €15k-€25k (worst outcome).