Case Study
EVOC: Crowdsourced Reports to Territorial Intelligence
How we turned wasp sightings into actionable surveillance data in 8 weeks—with <2min reporting, 120+ validated reports, and 40% faster review. [Read the case study]

From Crowdsourced Reports to Validated Territorial Intelligence
We’ve built several crowdsourcing platforms, and they all follow a pattern: collect inputs, celebrate engagement, then realize nobody’s making decisions from the data. EVOC was different—right from the start, the client needed actionable intelligence, not a pile of reports.
Most crowdsourcing platforms fail quietly. They collect reports, pile them into databases, and never turn inputs into decisions. EVOC—a platform for monitoring Vespa orientalis across Campania—forced us to answer a harder question: how do you go from raw sightings to validated territorial intelligence fast enough to matter?
The answer: treat crowdsourcing as a complete loop, not just data collection. Report → validate → aggregate → decide. Do it fast, do it trustworthy, and design for both sides—the citizen with 90 seconds in the field and the operator buried in unverified submissions.
This case study is a reusable playbook for any crowdsourcing MVP: environmental monitoring, civic reporting, supply chain visibility, or distributed quality control. For a broader guide on signal-first design, read Why Crowdsourcing Platforms Fail and How to Fix Them.
1. The Real Problem: Reports Are Not Signals
Crowdsourcing sounds simple. Ask people to report what they see. Collect the data. Act on it.
In practice, it fails at three predictable points:
High friction kills adoption. If reporting takes 5 minutes or requires account creation before you can submit, people drop off—especially in field conditions where internet is weak and time is short.
Raw inputs create noise, not clarity. A photo of “something that looks like a wasp” is not actionable intelligence. Without validation, you’re drowning in anecdotes.
Operational blind spots break scale. Teams focus on collecting data but not on reviewing it. Operators become bottlenecks. Trust erodes. The platform dies quietly.
Most MVPs don’t fail because the technology is wrong. They fail because the team makes learning slow and expensive. The difference between a demo and a real product is exactly this validation loop. (Read: First MVP—Demo vs. Real Product)
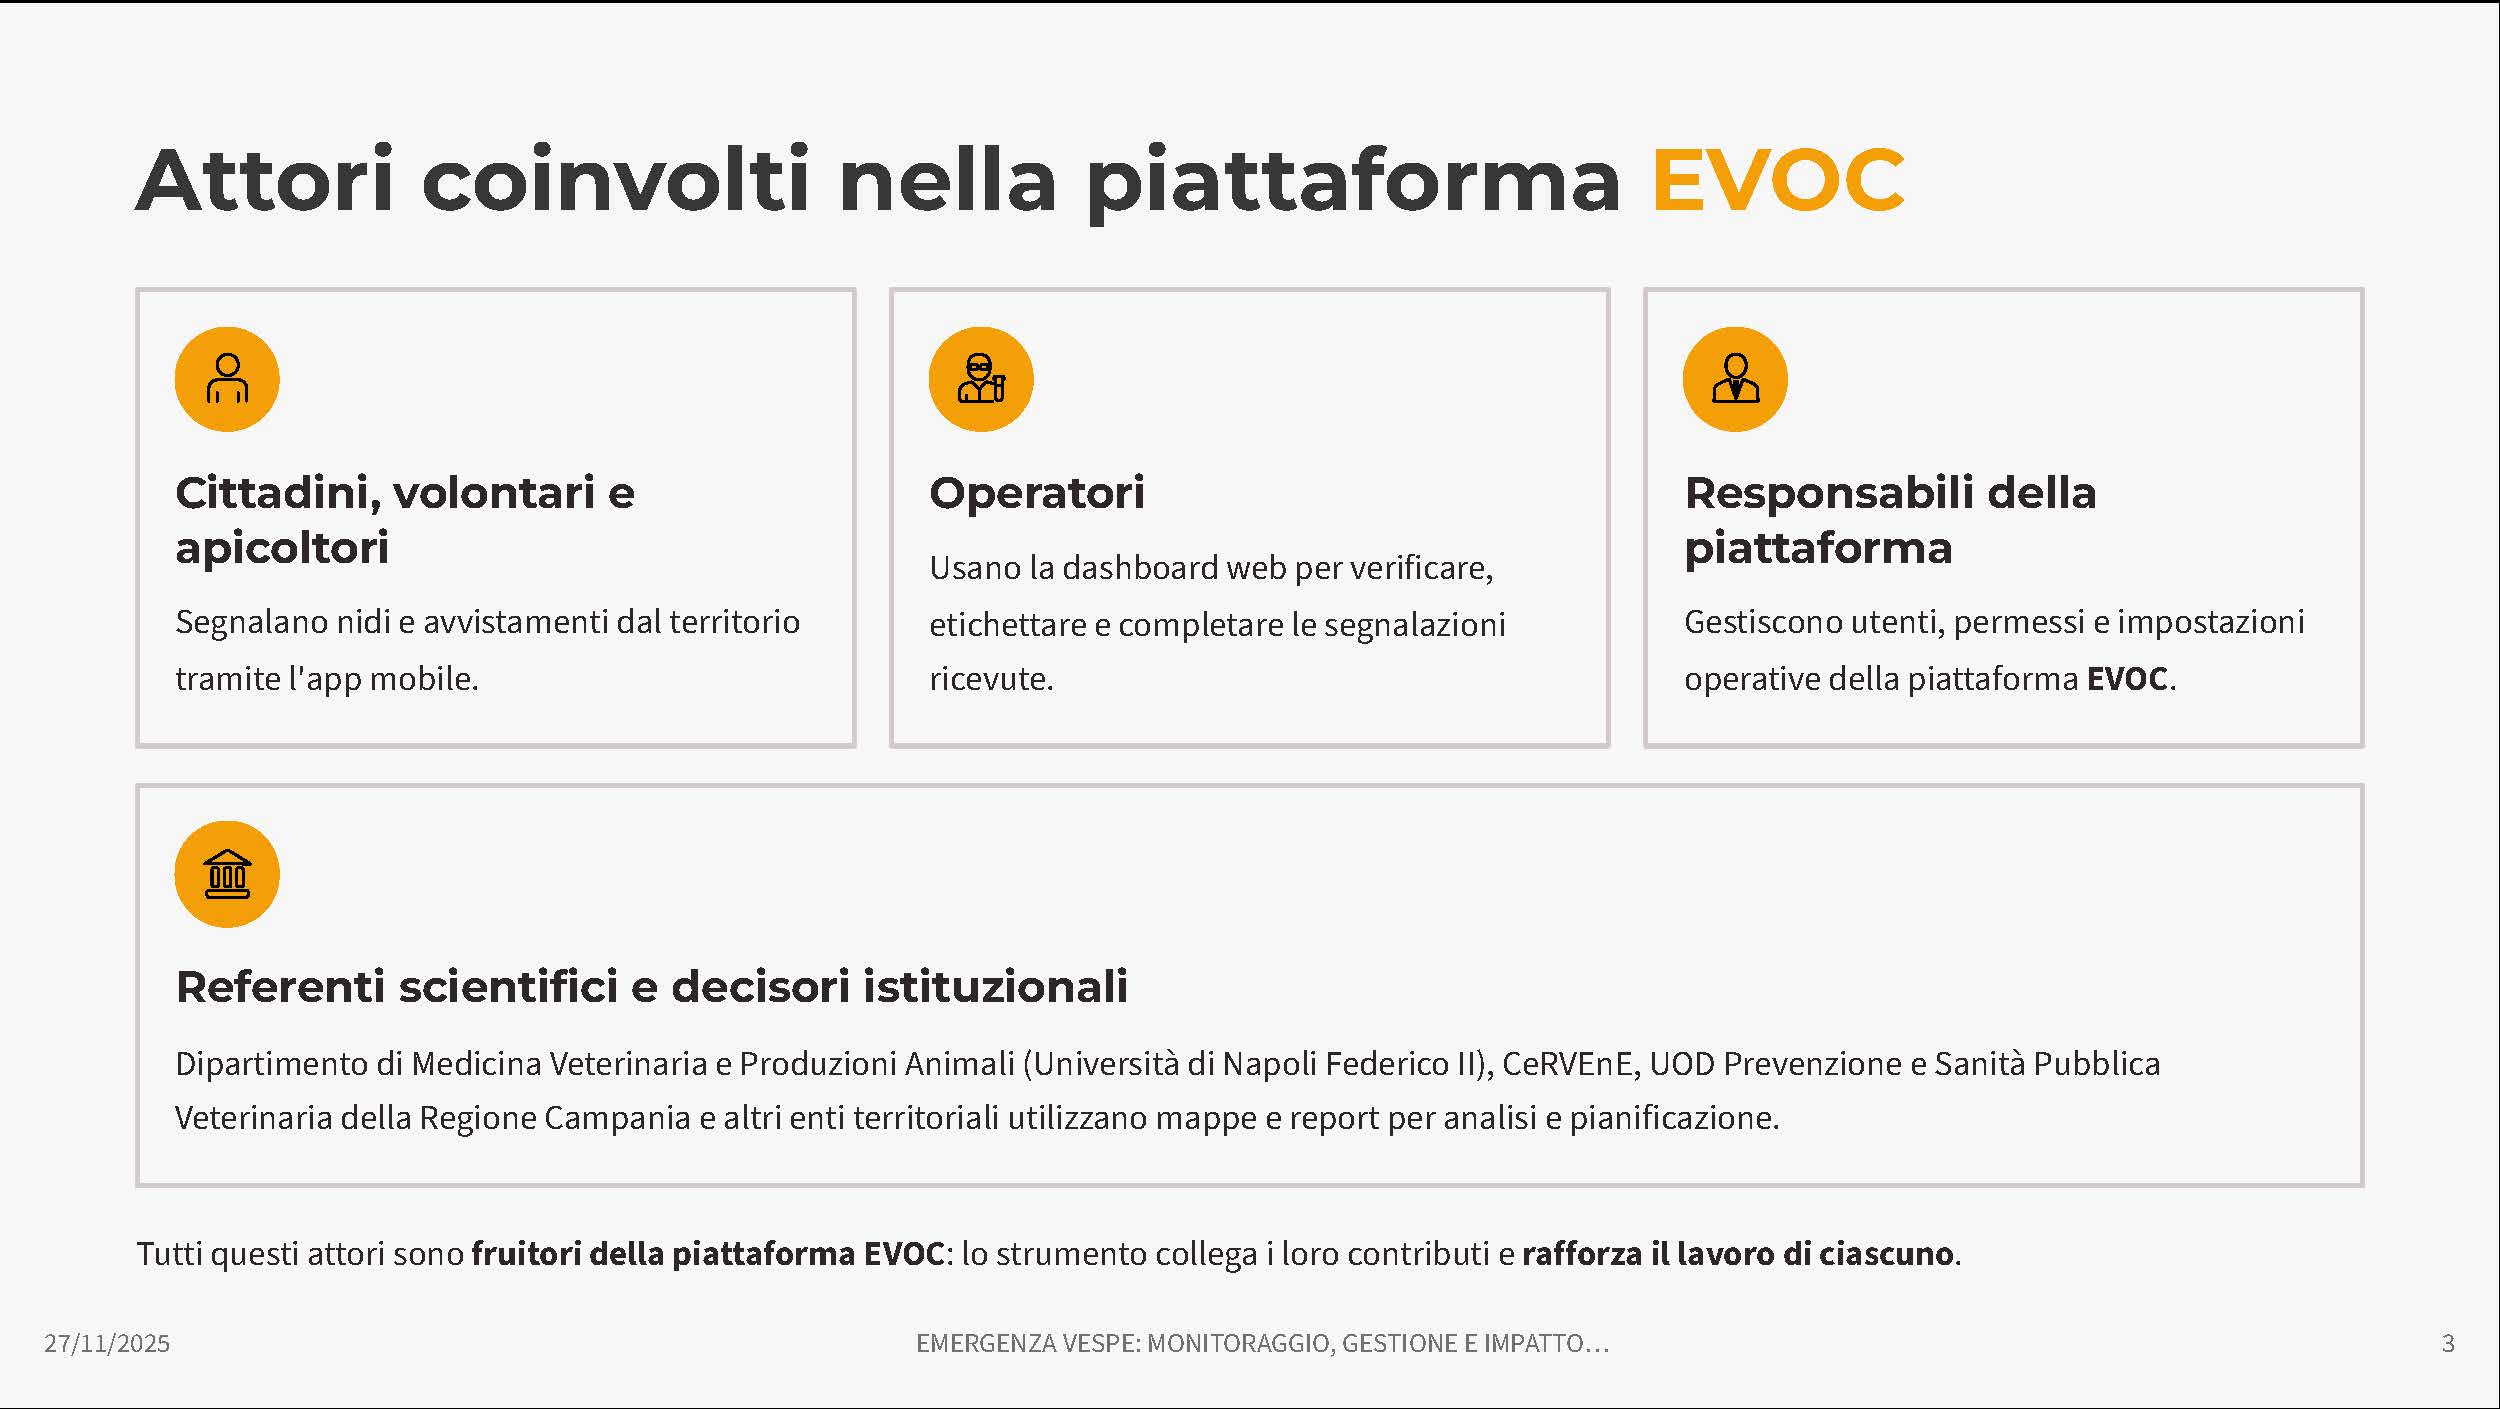
EVOC was created within the “Emergenza Api ed Insetti Impollinatori” area at CeRVEnE (Centro Regionale per la Prevenzione e Gestione delle Emergenze “Adriano Mantovani”) and the Department of Veterinary Medicine and Animal Productions at the University of Naples Federico II, with support from the Campania Region.
From day one, this wasn’t “just an app.” The challenge was building a complete system that could turn participation into territorial awareness—without creating technical debt or operational chaos.
2. What We Optimized For: Signal-First Design
We reframed success around signals we could observe early and improve release by release:
- Time-to-report: Can a citizen submit a useful report in <2 minutes, in real field conditions?
- Drop-off reduction: Do users complete the flow without assistance or confusion?
- Validation throughput: Can operators review/confirm/reject reports efficiently and consistently?
- Signal quality: Does the system separate noise from reliable data through structured workflows?
- Decision-ready aggregation: Do maps, filters, and exports turn individual reports into territory-level insight?
These weren’t aspirational KPIs. They were design constraints that shaped every architectural choice.
Scoping an MVP around signals—not features—is what separates noise from learning. (Learn how to scope an MVP around measurable outcomes)
3. System Overview: The Complete Loop
EVOC is structured as two interconnected parts built on a cloud foundation:
Mobile App (citizens, volunteers, beekeepers)
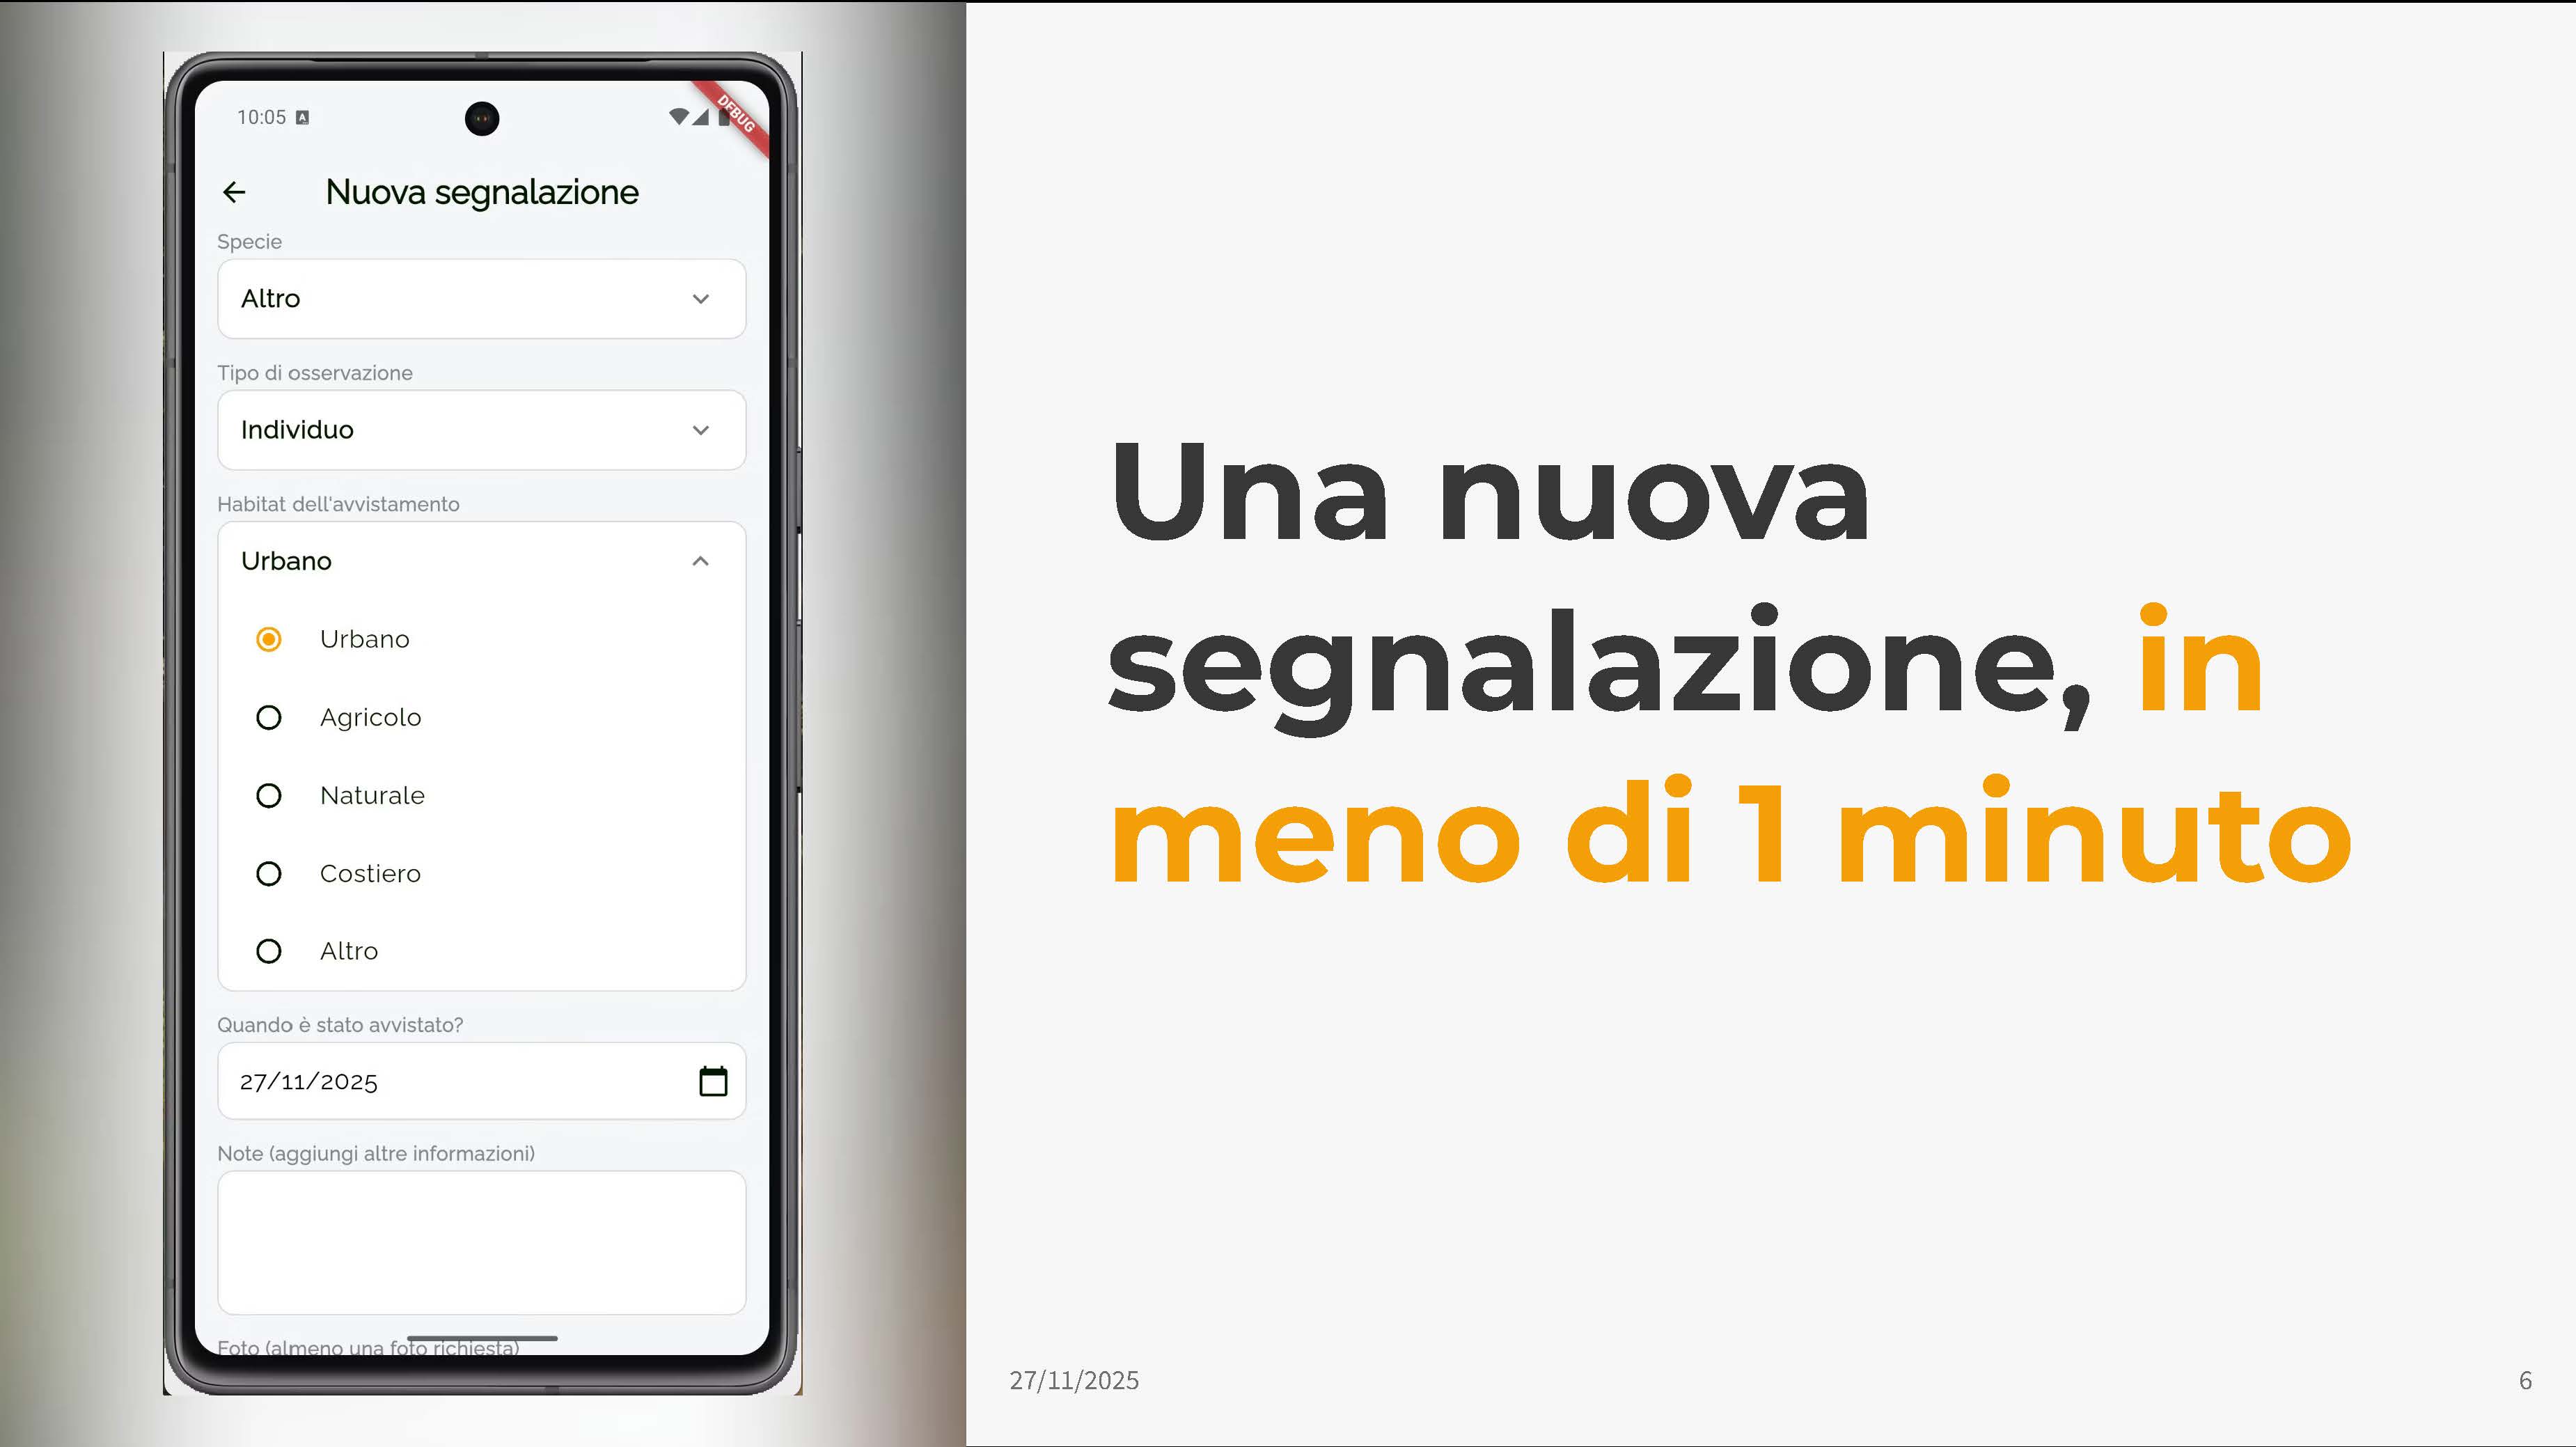
The mobile app is designed for fast, field-friendly reporting:
- Submit sightings and nests in <2 minutes
- Attach photos or videos (or select from gallery)
- Automatic geolocation extraction from media or device GPS
- Minimal required inputs: species, observation type, habitat, date
- Optional notes field for additional context
Web Dashboard (operators and institutions)
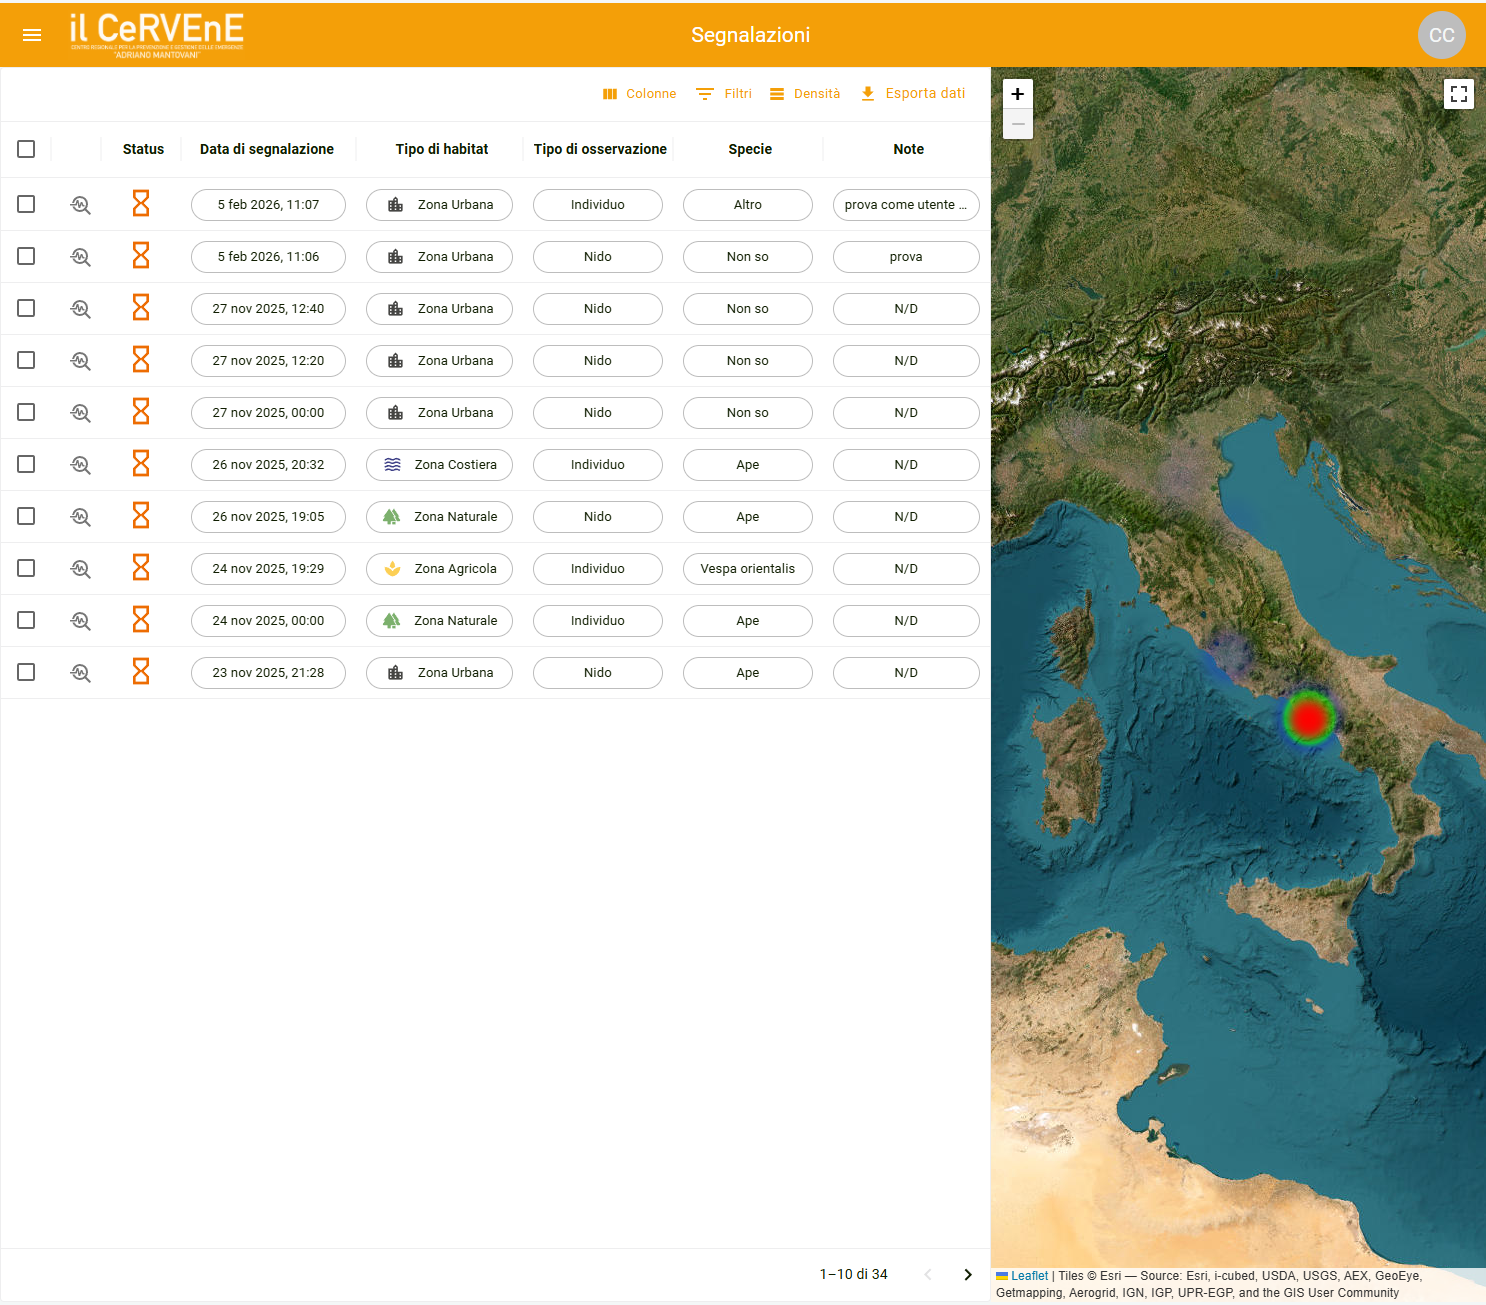
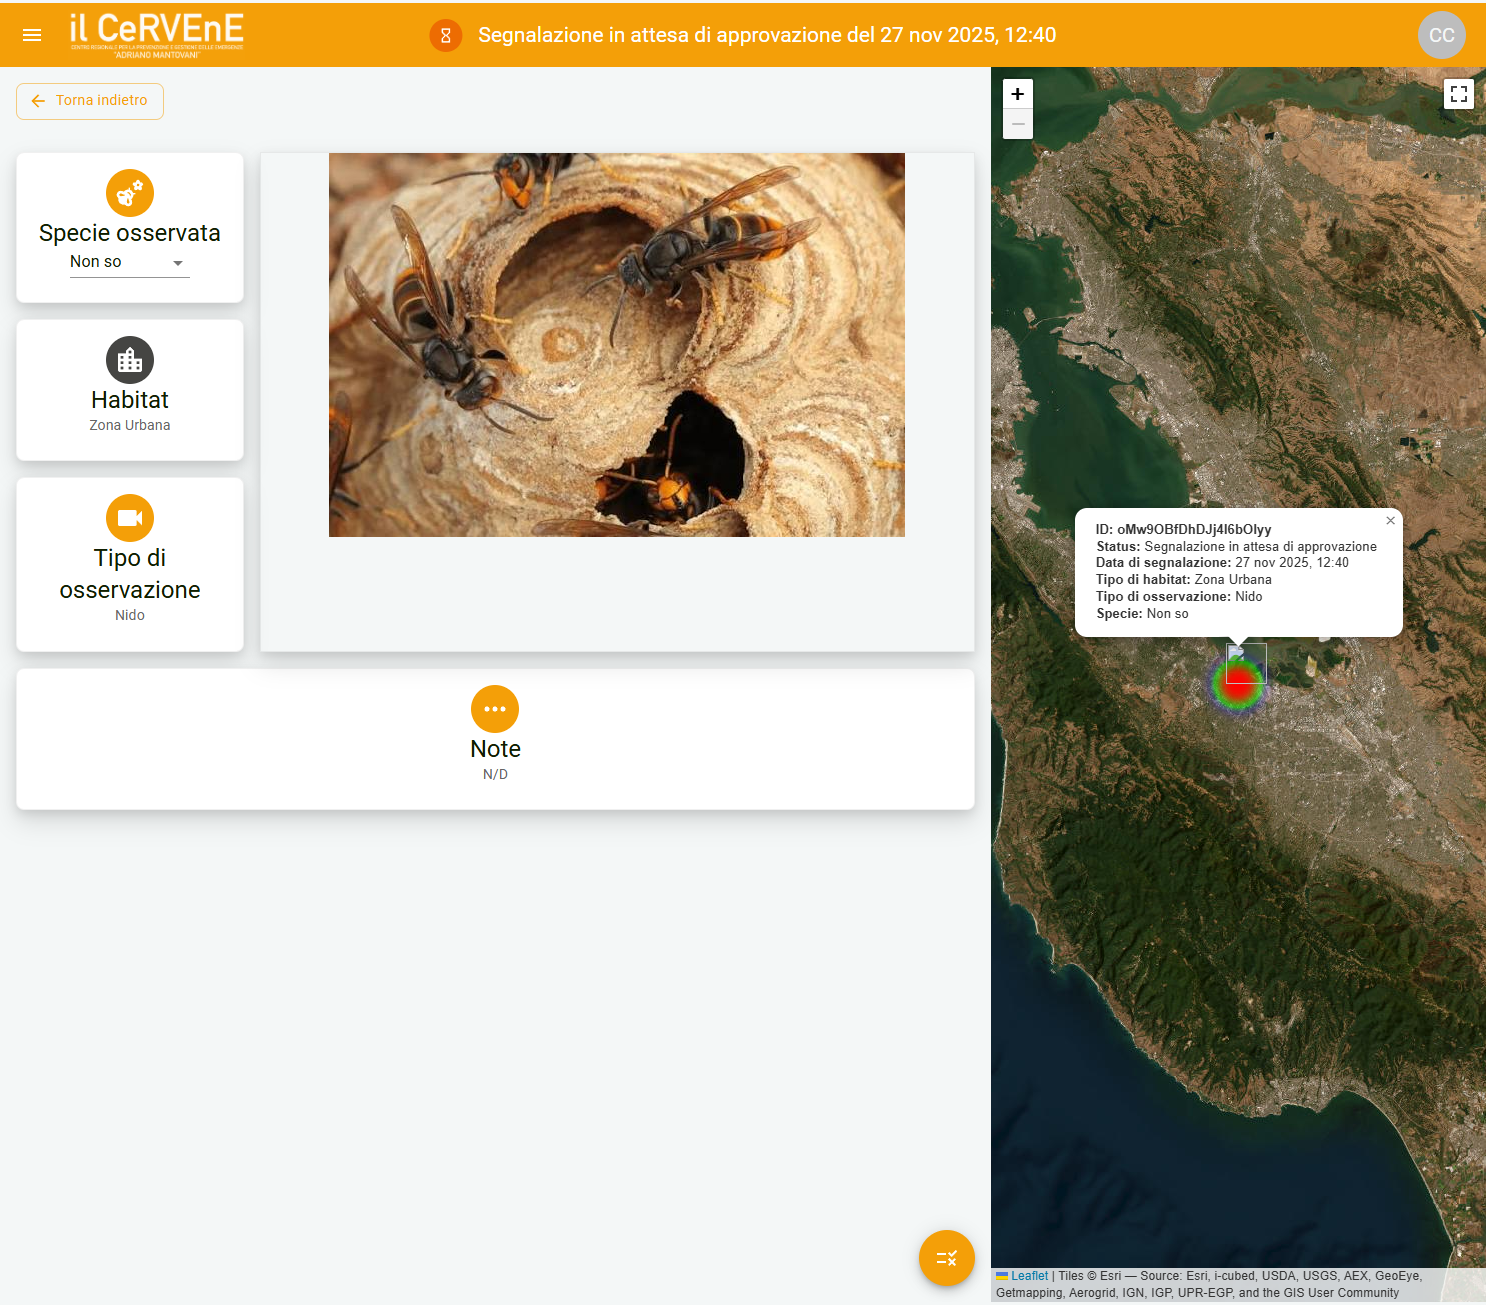
The dashboard is where raw reports become trusted signals:
- Structured review workflow (pending → validated/rejected)
- Ability to edit/correct species, location, or classification
- Tagging and labeling for analysis
- Interactive maps with heatmap visualization
- Advanced filters (date range, species, habitat, validation status)
- Data exports (CSV/Excel) for institutional reporting
Architecture Principles
We treated three things as non-negotiable:
Frictionless start with reversible identity. Users can report anonymously via Firebase Authentication (no upfront registration). Later, anonymous sessions can upgrade to full accounts without losing report history.
Validation workflow as a first-class feature. The operator dashboard wasn’t an afterthought. It’s where trust is built—through repeatable review, classification, and correction flows.
Cloud-native scalability without operational overhead. Built on Google Cloud with managed services, automated testing on critical paths, and deployment patterns designed for safe iteration.

4. Key Trade-Offs We Made (And Why They Matter)
Every MVP is a series of intentional trade-offs. Here’s where we drew the lines—and how these decisions shaped the product.
4.1 Frictionless Start vs. Stronger Identity
Trade-off: Allow reporting without upfront registration vs. require full accounts from day one.
Why it matters: Adoption depends on removing barriers, especially in field conditions. If someone sees a nest and has 90 seconds, they’ll submit or they’ll leave. Account creation can wait.
What we did: Firebase Authentication’s anonymous sign-in pattern. Users start frictionless. Later, the anonymous session upgrades to a full account without losing report ownership or history. This is not a hack—it’s a reversible architecture that lets you optimize for early adoption and long-term traceability.
4.2 “Complete Loop” MVP vs. “Just an App”
Trade-off: Invest early in the operator dashboard vs. ship only the citizen-facing app.
Why it matters: Crowdsourcing without validation creates unusable data. If you can’t review and correct submissions efficiently, the platform produces volume—not insight.
What we did: We built the MVP around a complete loop from the start: report → review → validate → aggregate → export. That’s what turns participation into decision support.
4.3 Speed via Accelerators vs. Hidden Technical Debt
Trade-off: Move faster using accelerators (including AI/no-code where useful) vs. risk fragile foundations.
Why it matters: Acceleration only helps if core workflows remain stable and maintainable. “Fast MVP” often means “rebuild in 6 months.”
What we did: We used accelerators with guardrails: protect critical flows with automated tests, keep boundaries clear, and avoid “magic” dependencies that are hard to operate later.
Using accelerators without guardrails is how fast MVPs become fragile prototypes. (Read: AI as Accelerator, Not Autopilot)
4.4 Flexible Capture vs. Standardized Analysis
Trade-off: Let users write anything freely vs. guide inputs into structured fields.
Why it matters: Structure enables reliable filtering, mapping, and exports. Unstructured inputs might feel easier, but they kill downstream workflows.
What we did: We kept input lightweight but structured: species dropdown, observation type categories, habitat types, date picker with smart defaults, optional notes field.
4.5 Feature Breadth vs. Operational Clarity
Trade-off: Add “nice-to-have” features early vs. strengthen review workflows and map insights first.
Why it matters: In monitoring/surveillance contexts, workflow clarity beats feature count. A simple, reliable system that produces trustworthy signals wins over a complex one that confuses operators.
What we did: We postponed features like offline-first sync, push notifications, and advanced role hierarchies until the core loop was validated.
5. What “8 Weeks to Test-Ready” Actually Meant
We treated EVOC as a focused MVP sprint: 8 weeks from kickoff to test-ready platform with real users.
“Test-ready” meant:
- Citizens could complete a report end-to-end in field conditions
- Operators could validate and classify submissions through a repeatable workflow
- Data was stored and protected well enough to invite institutions without anxiety
- Maps and exports produced actionable territorial insights
We intentionally prioritized: core workflows, stable data model, validation states, heatmap visualization.
We intentionally postponed: full offline-first guarantees, enterprise-grade observability, complex role hierarchies, advanced geospatial analytics.
The result: a credible, testable platform in weeks, not quarters—with a clear path to hardening and scaling.
Want to see a similar timeline applied to healthcare? Check out the LyLife case study: 30-day MVP for a parallel approach in a different domain. For a breakdown of what 4-8 week MVP timelines look like in practice, see our guide: MVP Roadmap: 4-8 Weeks.
6. Measuring Fast Validation (Instead of Guessing)
Validation is a process, not a milestone. If you can’t put numbers around delivery speed and signal quality, you’re guessing.
We combined delivery metrics with product-side signals.
6.1 Delivery Speed
We tracked: change lead time, deployment frequency, change failure rate, time to restore service.
These metrics show whether learning is getting faster or slower.
6.2 Product-Side MVP Metrics
We focused on three brutal early signals:
Report completion rate (~85%): Do users finish the submission flow or drop off mid-way?
Time-to-report (<2 minutes): How long does it take from “open app” to “report submitted”?
Operator review time (40% faster than manual triage): How quickly can an operator validate a batch of reports?
These metrics aren’t vanity numbers—they’re decision triggers. If completion drops or review slows, you know exactly where to look. (Learn how to measure MVP success with actionable metrics)
6.3 Signal Quality Indicators
Beyond speed, we monitored: acceptance rate after validation, classification consistency, heatmap utility.
Each metric connects directly to a decision. That’s how you turn “we think it’s working” into “we know what to change next.”
7. Common Mistakes That Slow Crowdsourcing MVPs
Across crowdsourcing projects, we see the same patterns:
- Collecting data without a validation plan
- Optimizing for volume metrics instead of signal quality
- Building only the citizen-facing side
- Using accelerators without guardrails
- Skipping measurement
EVOC was our way of designing those problems out from the start.
8. Results: Early Signals from Pilot Usage
Pilot usage started confirming key assumptions:
Citizen-Side Adoption
- Report completion rate: ~85% (high for crowdsourcing MVPs)
- Median time-to-report: <2 minutes (field-tested)
- Anonymous-to-account upgrade rate: tracking in progress
Operator-Side Efficiency
- Reports processed (first 2 weeks): 120+ (validated, not just submitted)
- Review time improvement: ~40% faster vs. manual triage
- Classification consistency: high
Institutional Value
- Heatmaps showing geographic clusters
- Export adoption by institutions
- Validation trust from decision-makers
9. What Comes Next: From “Test-Ready” to “Confident”
Once EVOC reached test-ready, the goal shifted to increasing confidence in the system.
We moved into a short hardening loop: reliability improvements, offline-first capabilities, notification system, environmental context, advanced analytics.
Each evolution follows the same principle: small, complete releases driven by real-world feedback.
Moving from test-ready to production-confident requires targeted hardening, not feature sprawl. (Product hardening checklist: from prototype to production)
10. Why This Worked
EVOC progressed effectively because:
- The MVP closed the loop end-to-end
- Releases were designed to generate learning signals
- Friction reduction didn’t compromise future traceability
- Accelerators were used with guardrails
- The collaboration model was partner-style
11. Reusable Principles for Your Crowdsourcing MVP
If you’re building a crowdsourcing platform:
- Close the loop from the start
- Design for both sides (citizen friction + operator clarity)
- Structure inputs without killing speed
- Use accelerators with guardrails
- Measure delivery speed and signal quality
Related Content
Continue Learning
- Why Crowdsourcing Platforms Fail and How to Fix Them — The broader guide to signal-first crowdsourcing design
- How to Scope an MVP — Scoping around signals, not features
- How to Measure MVP Success — Delivery + product metrics in practice
See Another MVP Example
- LyLife: From Idea to Test-Ready in 30 Days — Healthcare MVP with similar principles, different domain
About Byte-sized
Byte-sized is an Italian boutique product studio that helps founders and SMEs turn ideas into real software—starting with MVPs built to learn fast from the market. We ship small but complete releases, keep scope and roadmaps clear, and reduce product and technical risk.
Want to build a crowdsourcing MVP that produces real signals—fast?
Contact us
Next step
Ready for the next byte?
Turn this framework into a scoped MVP plan with a tight delivery loop.